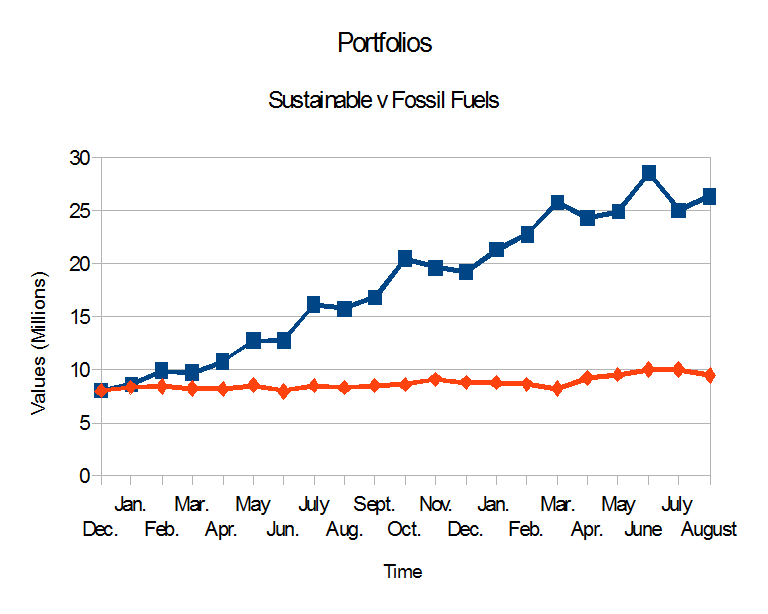
 On Dec. 21, 2012, I put $16 Million imaginary dollars in equal imaginary investments in 16 real energy companies; $8.0 iMil in the Sustainable Energy space and $8.0 iMil in the fossil fuel space.
-
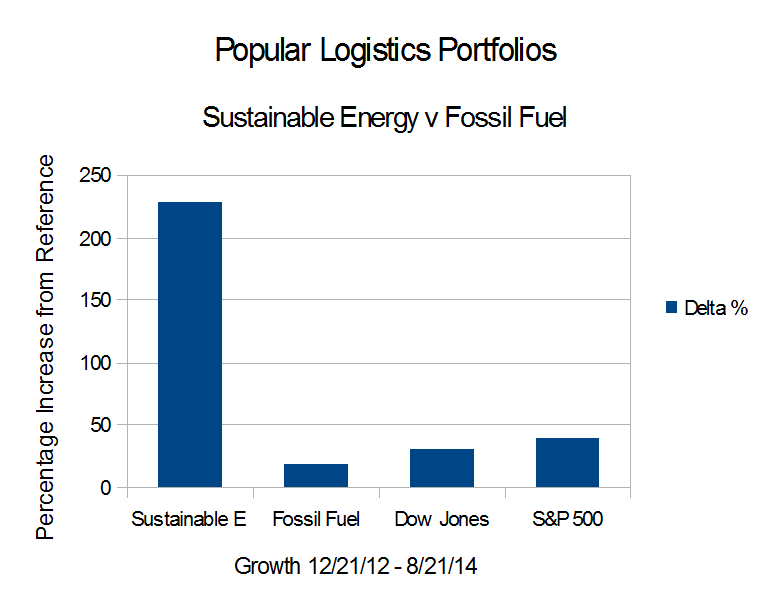
The Dow Jones Industrial Average is up 30.16 % from 12/21/12.
-
The S&P 500 is up 39.3% from 12/21/12.
-
The Fossil Fuel Portfolio continues to dramatically underperform the reference indices. It is up 18.36% from Dec. 21, 2012 and down 5.67% from July, 2014.
- The Sustainable Energy portfolio is up 229.19% from Dec. 21, 2012.
 The Sustainable Energy portfolio is composed of Cree and Lighting Sciences in the LED space, GT Advanced Technologies, First Solar and Sunpower in the solar space, Vestas, a wind company, Solazyme a biofuel company and Next Era, a utility. The fossil fuel companies are the oil companies BP, Chevron Texaco, Conoco Phillips, Exxon Mobil and RD Shell, the coal company Peabody Energy, and Haliburton and Transocean Ltd, companies in the offshore oil and oil and gas drilling service industries. The Sustainable Energy portfolio does not include Tesla and Solar City.
The data are summarized beginning in Table 1, below.
| Summary Data | ||||
| Portfolio | 12/21/12 | 08/21/14 | Delta | % |
| Sustainable Energy | 8,000,000 | 26,335,038 | 18,335,038 | 229.19% |
| Fossil Fuel | 8,000,000 | 9,469,177 | 1,469,177 | 18.36% |
| DJI | 13,091 | 17,039 | 3,948 | 30.16% |
| S&P 500 | 1,430 | 1,992 | 562 | 39.30% |
| Table 1 | ||||
The stock price data for the Sustainable Energy portfolio are in Table 2, below.
| Sustainable Energy Portfolio – Stock Prices | ||||||
| Item | Company | Symbol | 12/21/12 | 08/21/14 | Delta | Delta % |
| 1 | Cree | CREE | 34.0 | 45.1 | 11.07 | 32.56% |
| 2 | First Solar | FSLR | 31.0 | 70.7 | 39.70 | 128.06% |
| 3 | GT Adv. Tech. | GTAT | 3.0 | 17.7 | 14.66 | 488.67% |
| 4 | Lighting Science | LSCG | 0.8 | 0.2 | -0.56 | -74.67% |
| 5 | Next Era Energy | NEE | 70.0 | 98.0 | 28.01 | 40.01% |
| 6 | Sun Power | SPWR | 5.4 | 37.5 | 32.04 | 590.06% |
| 7 | Solazyme | SZYM | 8.3 | 9.2 | 0.83 | 9.95% |
| 8 | Vestas | VWS | 6.3 | 45.4 | 39.05 | 618.86% |
| Table 2 | ||||||
The stock price data for the Fossil Fuel Portfolio are in Table 3, below.
| Fossil Fuel Portfolio – Stock Prices | ||||||
| Item | Company | Symbol | 12/21/12 | 08/21/14 | Delta | Delta % |
| 1 | BP | BP | 42.1 | 48.3 | 6.15 | 14.60% |
| 2 | Chevron Texaco | CVX | 109.7 | 127.9 | 18.22 | 16.61% |
| 3 | Conoco Philips | COP | 58.6 | 81.0 | 22.38 | 38.19% |
| 4 | Exxon Mobil | XOM | 87.2 | 99.3 | 12.03 | 13.79% |
| 5 | Royal Dutch Shell | RDS.A | 69.3 | 79.8 | 10.50 | 15.15% |
| 6 | Haliburton | HAL | 34.7 | 68.3 | 33.63 | 96.89% |
| 7 | Transocean | RIG | 45.6 | 38.7 | -6.97 | -15.27% |
| 8 | Peabody Coal | BTU | 26.4 | 16.3 | -10.03 | -38.06% |
| Table 3 | ||||||
The valuation data for the Sustainable Energy Portfolio are in Table 4, below.
| Sustainable Energy Portfolio – Valuation | ||||||
| Value | Delta | |||||
| Item | Company | Symbol | 12/21/12 | 08/21/14 | Delta | Delta % |
| 1 | Cree | CREE | 1,000 | 1,326 | 326 | 32.56% |
| 2 | First Solar | FSLR | 1,000 | 2,281 | 1,281 | 128.06% |
| 3 | GT Adv. Tech. | GTAT | 1,000 | 5,887 | 4,887 | 488.67% |
| 4 | Lighting Science | LSCG | 1,000 | 253 | -747 | -74.67% |
| 5 | Next Era Energy | NEE | 1,000 | 1,400 | 400 | 40.01% |
| 6 | Sun Power | SPWR | 1,000 | 6,901 | 5,901 | 590.06% |
| 7 | Solazyme | SZYM | 1,000 | 1,100 | 100 | 9.95% |
| 8 | Vestas | VWS | 1,000 | 7,189 | 6,189 | 618.86% |
| total | 8,000 | 26,335 | 18,335 | 229.19% | ||
| Note that the values are in thousands. | ||||||
| Table 4 | ||||||
The valuation data for the Fossil Fuel Portfolio are in Table 5, below.
| Fossil Fuel Portfolio – Valuations | ||||||
| Value | Delta | |||||
| Item | Company | Symbol | 12/21/12 | 08/21/14 | Amount | Per Cent |
| 1 | BP | BP | 1,000 | 1,146 | 146 | 14.60% |
| 2 | Chevron Texaco | CVX | 1,000 | 1,166 | 166 | 16.61% |
| 3 | Conoco Philips | COP | 1,000 | 1,382 | 382 | 38.19% |
| 4 | Exxon Mobil | XOM | 1,000 | 1,138 | 138 | 13.79% |
| 5 | Royal Dutch Shell | RDS.A | 1,000 | 1,152 | 152 | 15.15% |
| 6 | Haliburton | HAL | 1,000 | 1,969 | 969 | 96.89% |
| 7 | Transocean | RIG | 1,000 | 847 | -153 | -15.27% |
| 8 | Peabody Coal | BTU | 1,000 | 628 | -372 | -37.23% |
| total | 8,000 | 9,427 | 1,427 | 17.84% | ||
| Note that the values are in thousands. | ||||||
| Table 5 | ||||||
The market capitalization data for the Sustainable Energy Portfolio are in Table 6, below.
| Sustainable Energy Portfolio | ||
| Market Capitalization | ||
| Item | Company | Market Cap |
| 1 | Cree | 6.1 |
| 2 | First Solar | 6.3 |
| 3 | GT Adv. Tech. | 2.0 |
| 4 | Lighting Science | 0.1 |
| 5 | Next Era Energy | 43.0 |
| 6 | Sun Power | 6.7 |
| 7 | Solazyme | 0.7 |
| 8 | Vestas | 10.3 |
| total | 75.16 | |
| Table 6 | ||
The market capitalization data for the Fossil Fuel Portfolio are in Table 7, below.
| Fossil Fuel Portfolio | ||
| Market Capitalization | ||
| Item | Company | Market Cap |
| 1 | BP | 156.3 |
| 2 | Chevron Texaco | 249.9 |
| 3 | Conoco Philips | 103.8 |
| 4 | Exxon Mobil | 442.6 |
| 5 | Royal Dutch Shell | 261.7 |
| 6 | Haliburton | 60.0 |
| 7 | Transocean | 15.6 |
| 8 | Peabody Coal | 4.2 |
| total | 1294.1 | |
| Table 7 | ||
Posts in this series
- L. Furman, 12/21/12, Popular Logistics Sustainable Energy Portfolio,
- L. Furman, 2/8/13, Nega-Watts, Nega-Fuel-Watts, Mega-Bucks,
- L. Furman, 2/9/13, Gold Bricks and Sink-Holes – The Risk & Reward of Fossil Fuel, Solar & Wind,
- L. Furman, 3/2/13, Sustainable Energy Portfolio UP 16% & Fossil Fuel Portfolio Up 1.7% – Since Dec.21, 2012..
- L. Furman, 3/23/13, Portfolio Simulation At 3 Months: Sustainable Energy: Up 22%. Fossil Fuels: 3%.
- L. Furman, 4/26/13, Earth Day, 2013. Oil Spills, Explosions, Fracking Business As Usual & The Stock Market Response
- L. Furman, 5/13/13, Popular Logistics Energy Portfolios: The Trend Continues.
- L. Furman, 6/24/13, Popular Logistics Energy Portfolios: At 6 months
- L. Furman, 7/22/13, Popular Logistics Energy Portfolios: Sustainable Energy Doubles. Fossil Fuels increase 5.4%
- L. Furman, 8/22/13, Popular Logistics Energy Portfolios: An Exercise in Climate Capitalism
- L. Furman, 9/20/13, Energy Portfolios – Investing for the Future
- L. Furman, 10/21/13, Sustainable Investing – Green Energy, Green Economy
- L. Furman, 11/22/13, Energy Portfolios: Minor Corrections, Overall Results In Line With the Trend
- L. Furman, 12/23/13, Energy Portfolios at One Year Sustainable Energy up 140%. Fossil Fuels up 9.85%.
- L. Furman, 12/26/13, Energy Portfolios and Reference Indices, 2013 Summary.
- L. Furman, 1/22/14, Energy Portfolios: 13 Months, Sustainable Energy up 167.4%, Fossil Fuels up 9.44%.
- L. Furman, 2/24/14, Energy Portfolios: 14 Months: Sustainable Energy up 184.4%, Fossil Fuels up 8.7%
- L. Furman, 3/23/14, Energy Portfolios: 15 Months: Sustainable Energy up 222.6, Fossil Fuel up 7.3%
- L. Furman, 4/22/14, Energy Portfolios, 16 Months: Sustainable Energy up 204.25%, Fossil Fuel up 15.38%
- L. Furman, 5/21/14, Energy Portfolios, 17 Months: Sustainable Energy up 211.6%, Fossil Fuels up 18.5%
- L. Furman, 6/24/14, Energy Portfolios, 18 Months: Sustainable Energy up 257%, Fossil Fuels up 24.6%
- L. Furman, 6/26/14, Energy Portfolios: 18 Months, Analysis
- L. Furman, 7/22/14, Energy Portfolios: 19 Months: Sustainable Energy up 222%, Fossil Fuels up 25%
- L. Furman, 8/23/14, Energy Portfolios: 20 Months: Sustainable Energy up 229%, Fossil Fuels up 18.4%
–
I, Larry Furman, an analyst with Popular Logistics, hold a BS and an MBA, am available for consulting in various domains and can be reached at “lfurman97” at G Mail. My goal in these posts is to present and discuss phenomena which I find interesting and which appear indicative of systemic shifts in the economy. Investments in equities of various companies are risky. I do NOThold a “Series 6″ or “Series 7″ license from the SEC or any similar licensing body. I am NOT a licensed stock broker, investment adviser or financial adviser and this should n0t be considered “Financial Advice” or “Investment Advice.”