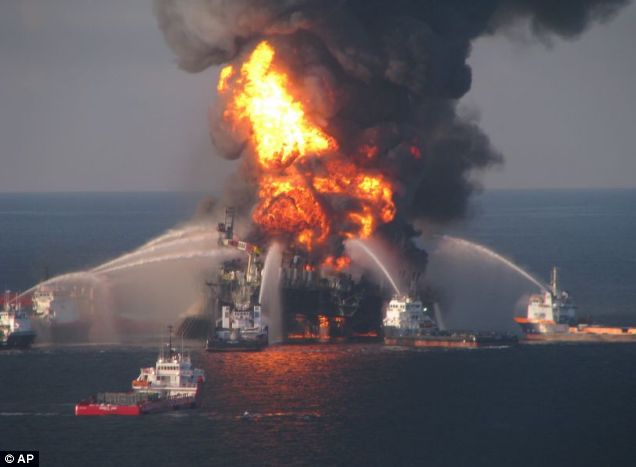
The Deepwater Horizon Spill
“You can’t have oil without oil spills.” – Markwayne Mullin, R, Oklahoma. (Official / GovTrack)
Wind and Sun Won’t Spill
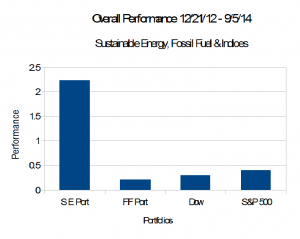
In a period when the Dow Industrials rose 30%, the S&P 500 rose 40%, and the Popular Logistics “Sustainable Energy Portfolio” rose 223%, the “Fossil Fuel Portfolio” rose 21%.
This suggests that a paradigm shift is underway in the energy industry.
Figure 1 and Table 1, below, show overall performance of these portfolios compared to the Dow Jones Industrial Average and the S&P 500.
 –
–
| Overall Data | ||||
| Index | 12/21/12 | 09/05/14 | Delta | Delta % |
| S E Port | 8,000 | 25,852.4 | 17,852.4 | 223.16% |
| FF Port | 8,000 | 9,647.6 | 1,647.6 | 20.59% |
| Dow | 13,191 | 17,137 | 3,946.6 | 29.92% |
| S&P 500 | 1,430 | 2,008 | 577.6 | 40.39% |
| Table 1 | ||||
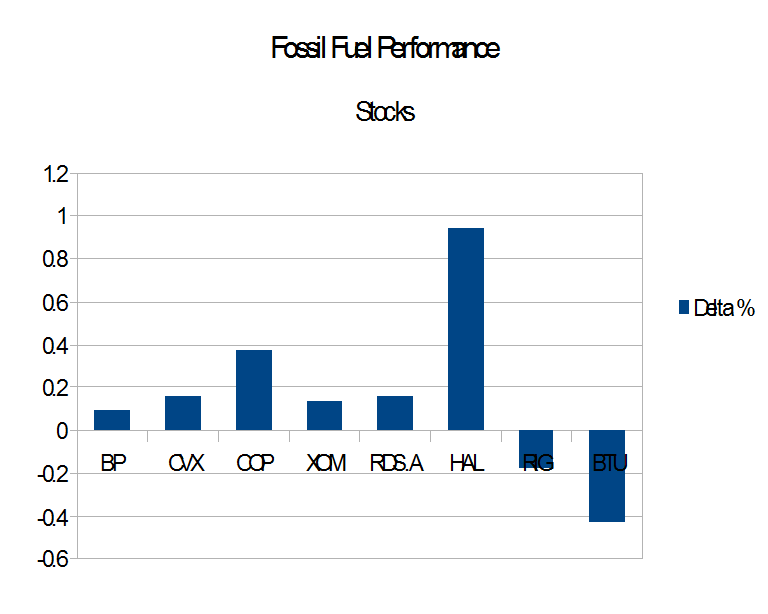
Figure 2 and Table 2, below, shows individual performance of companies in the Fossil Fuel portfolio.
 –
–
| Fossil Fuel Portfolio Results | ||||
| Company | Pri 12/21/12 | Pri 9/5/14 | Difference | Delta % |
| BP | 42.12 | 45.93 | 3.81 | 9.05% |
| CVX | 109.71 | 127.40 | 17.69 | 16.12% |
| COP | 58.6 | 80.35 | 21.75 | 37.12% |
| XOM | 87.23 | 99.26 | 12.03 | 13.79% |
| RDS.A | 69.29 | 80.17 | 10.88 | 15.70% |
| HAL | 34.71 | 67.45 | 32.74 | 94.32% |
| RIG | 45.64 | 37.60 | -8.04 | -17.62% |
| BTU | 26.35 | 15.08 | -11.27 | -42.77% |
| Table 2 | ||||
Analysis and Conclusions
- Best Performers, 1. Two companies in the Fossil Fuel portfolio, Conoco Phillips, COP, and Haliburton, HAL, have done very well, compared to others in the portfolio. The stock price of COP has increased 38.2% from 12/21/12 to 8/21/14. It has outperformed the Dow Industrials while essentially matching the S&P 500. The stock price of HAL has increased 96.9% in the same time frame.
- Best Performers, 2. It bears repeating that Conoco Philips, the second best performing in the fossil fuel portfolio has essentially matched the S&P 500.
- Worst Performers. Conversely, the worst performers Peabody Energy, BTU, down 37.2% and Transocean, RIG, down 15.3%, would have been spectacularly bad investments.
- The Deepwater Horizon and the Stock Market. The companies responsible for the Deepwater Horizon incident, BP, Haliburton, and Transocean, are included in the Fossil Fuel portfolio. Haliburton, as noted above, is the best performing company in the Fossil Fuel portfolio. BP increased 14.6%, in line with the performance of the other oil companies in the portfolio except Conoco Philips, dramatically underperformed the Dow and the S&P. Transocean lost 34.2 of it’s value. In this incident, which began in April, 2010, the US government showed that at least 3.2 Million barrels of oil gushed into the Gulf of Mexico from the Macondo Oil Field. On Tuesday, Sept. 2, 2014, it was announced that Haliburton will pay a $1.1 Billion penalty for it’s role (Bloomberg Business Week, here). On Thursday, Sept. 4, 2014 BP was found “Grossly Negligent” and 67% responsible for the spill. Transocean was found to be 30% responsible, Halliburton was found to be 3% responsible. (NY Times, Mother Jones). BP faces as much as $18 Billion in fines, on top of the $28 Billion in clean-up costs that it paid out. As Oklahoma Congressman MarkWayne Mullins may have said, “We can’t have oil without oil spills.”
- The Deepwater Horizon, the Stock Market, and the White House. Haliburton, coincidentally, has very strong ties to Richard B. Cheney, who served as Vice President of the United States from January, 2001 to January 2009.
Posts in this series
- L. Furman, 12/21/12, Popular Logistics Sustainable Energy Portfolio,
- L. Furman, 2/8/13, Nega-Watts, Nega-Fuel-Watts, Mega-Bucks,
- L. Furman, 2/9/13, Gold Bricks and Sink-Holes – The Risk & Reward of Fossil Fuel, Solar & Wind,
- L. Furman, 3/2/13, Sustainable Energy Portfolio UP 16% & Fossil Fuel Portfolio Up 1.7% – Since Dec.21, 2012..
- L. Furman, 3/23/13, Portfolio Simulation At 3 Months: Sustainable Energy: Up 22%. Fossil Fuels: 3%.
- L. Furman, 4/26/13, Earth Day, 2013. Oil Spills, Explosions, Fracking Business As Usual & The Stock Market Response
- L. Furman, 5/13/13, Popular Logistics Energy Portfolios: The Trend Continues.
- L. Furman, 6/24/13, Popular Logistics Energy Portfolios: At 6 months
- L. Furman, 7/22/13, Popular Logistics Energy Portfolios: Sustainable Energy Doubles. Fossil Fuels increase 5.4%
- L. Furman, 8/22/13, Popular Logistics Energy Portfolios: An Exercise in Climate Capitalism
- L. Furman, 9/20/13, Energy Portfolios – Investing for the Future
- L. Furman, 10/21/13, Sustainable Investing – Green Energy, Green Economy
- L. Furman, 11/22/13, Energy Portfolios: Minor Corrections, Overall Results In Line With the Trend
- L. Furman, 12/23/13, Energy Portfolios at One Year Sustainable Energy up 140%. Fossil Fuels up 9.85%.
- L. Furman, 12/26/13, Energy Portfolios and Reference Indices, 2013 Summary.
- L. Furman, 1/22/14, Energy Portfolios: 13 Months, Sustainable Energy up 167.4%, Fossil Fuels up 9.44%.
- L. Furman, 2/24/14, Energy Portfolios: 14 Months: Sustainable Energy up 184.4%, Fossil Fuels up 8.7%
- L. Furman, 3/23/14, Energy Portfolios: 15 Months: Sustainable Energy up 222.6, Fossil Fuel up 7.3%
- L. Furman, 4/22/14, Energy Portfolios, 16 Months: Sustainable Energy up 204.25%, Fossil Fuel up 15.38%
- L. Furman, 5/21/14, Energy Portfolios, 17 Months: Sustainable Energy up 211.6%, Fossil Fuels up 18.5%
- L. Furman, 6/24/14, Energy Portfolios, 18 Months: Sustainable Energy up 257%, Fossil Fuels up 24.6%
- L. Furman, 6/26/14, Energy Portfolios: 18 Months, Analysis
- L. Furman, 7/22/14, Energy Portfolios: 19 Months: Sustainable Energy up 222%, Fossil Fuels up 25%
- L. Furman, 8/23/14, Energy Portfolios: 20 Months: Sustainable Energy up 229%, Fossil Fuels up 18.4%
- L. Furman, 8/29/14, Energy Portfolios: 20 Months: Conclusion & Observations
- L. Furman, 9/7/14, Energy Portfolios: Simple Analysis re Fossil Fuels.
–
I, Larry Furman, am an analyst with Popular Logistics. I hold a BS and an MBA. I am available for consulting in various domains and can be reached at “LFurman . MBA” at G Mail. My goal in these posts is to present and discuss phenomena which I find interesting and which appear indicative of systemic shifts in the economy. Investments in equities of various companies are risky. I do NOT hold a “Series 6″ or “Series 7″ license from the SEC or any similar licensing body. I am NOT a licensed stock broker, investment adviser or financial adviser and this should n0t be considered “Financial Advice” or “Investment Advice.”