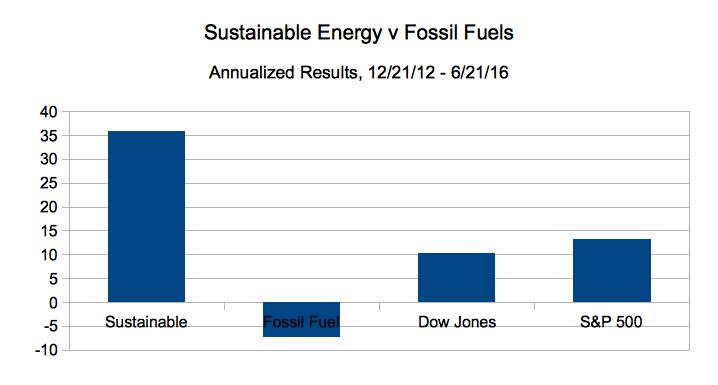
On Dec. 21, 2012, I put $16 Million imaginary dollars into 16 real energy companies; $8.0 in the Sustainable Energy space and $8.0 in the fossil fuel space, $1.0 Million into each. Excluding the value of dividends and transaction costs, but including the bankruptcy or crash of three companies in the sustainable energy space,
As of the close of trading 57 months later,
- The Market Capitalization of the sustainable energy companies is up 145.3%, from $39.58 Billion to $97.07 Billion. (See Table 6, below).
- The Market Capitalization of the Fossil Fuel portfolio is DOWN 5.5%, from $1.099 Trillion to $1.029 Trillion. (See Table 7, below).
- And the Market Capitalization of the Big Oil companies, PB, Exxon, Chevron, Conoco Philips and Shell, is down 11.84%, from $1.034 Trillion on 12/21/12 to $987.8 Billion on 9/21/17. (See Table 8, below).
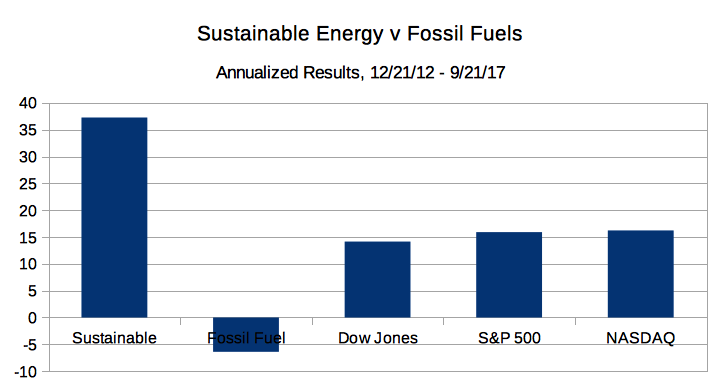
As of the close of trading on September 21, 2017:
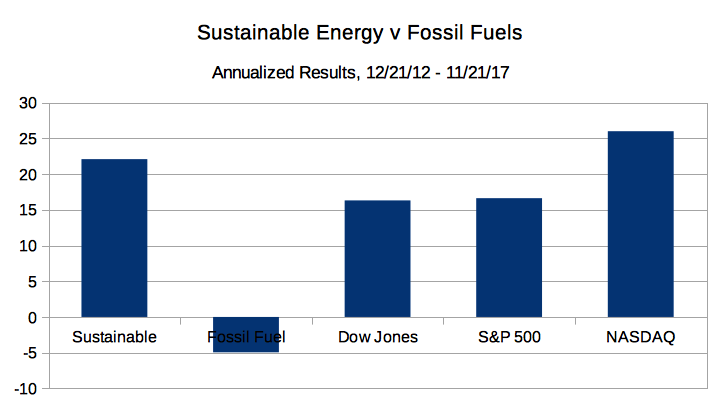
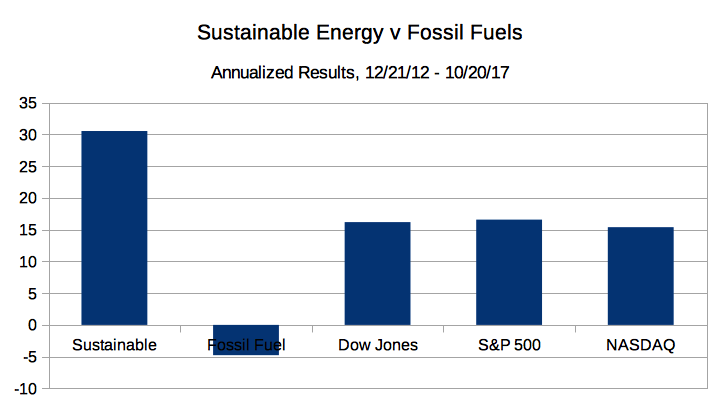
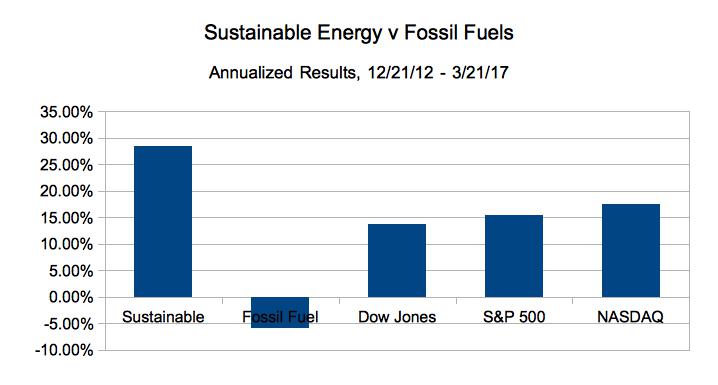
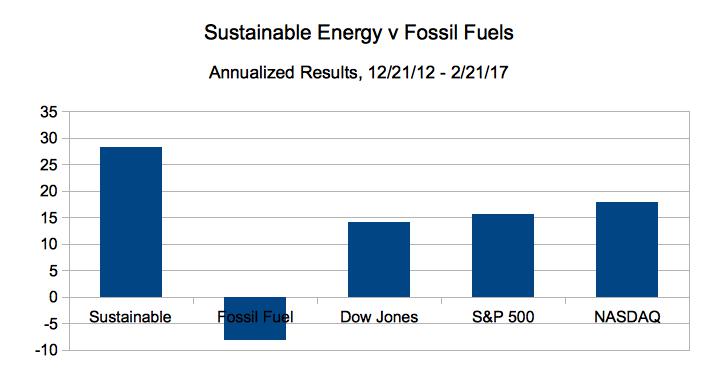
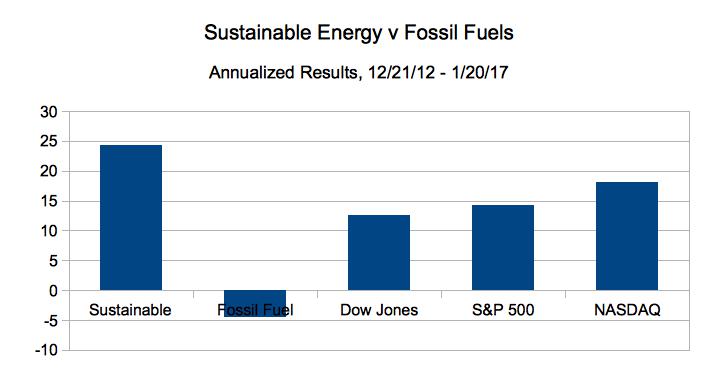
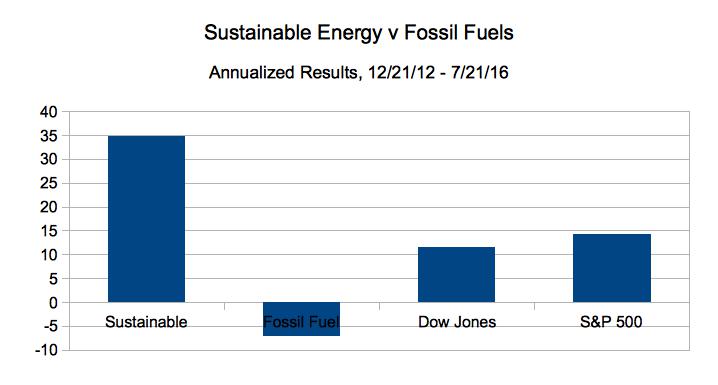
- The Fossil Fuel portfolio went from $8.0 Million to $5.85 Million, down 26.93% overall, down 5.77% on an annualized basis.
- The Sustainable Energy portfolio went from $8 Million to $20.32 Million, up 153.94%, overall and 32.99% on an annualized basis.
- The Dow Jones Industrial Average is up 65.8% overall and 13.85% on an annualized basis; from 13,091 on 12/21/12 to 21,704 on 9/21/17.
- The S&P 500 is up 69.8% overall and 14.69% on an annualized basis, from 1,430 on 12/21/12 to close at 2,428 on 9/21/17.
The Sustainable Energy portfolio includes First Solar (FSLR) and Sunpower Corp. (SPWR) in the solar space, Vestas (VWSYF), a wind company, Next Era Energy (NEE), a utility, Solazyme (SZYM) a biofuel company, Cree (CREE) and Lighting Sciences (LSCG) in the LED space and GT Advanced Tech (GTAT), which in Dec. 2012 made solar ovens for cooking PV wafers.
The fossil fuel companies are the oil companies British Petroleum (BP), Chevron Texaco (CVX), Conoco Phillips (COP), Exxon Mobil (XOM) and RD Shell (RDS.A), the now bankrupt coal company, Peabody Coal, and Haliburton (HAL) and Transocean (RIG), companies in the offshore oil and oil and gas drilling service industries.
The data are summarized beginning in Table 1, below.
| Summary Data |
| Portfolio |
12/21/12 |
09/21/17 |
Delta |
Delta % |
Annualized |
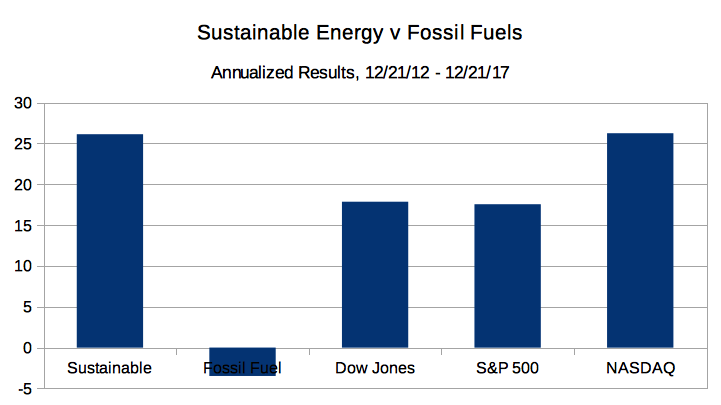
| Sustainable Energy |
8,000,000 |
20,315,038 |
12,315,038 |
153.94% |
32.41% |
| Fossil Fuel |
8,000,000 |
5,845,911 |
-2,154,089 |
-26.93% |
-5.67% |
| DJI |
13,091 |
21,704 |
8,613 |
65.79% |
13.85% |
| S&P 500 |
1,430 |
2,428 |
998 |
69.79% |
14.69% |
| NASDAQ |
3,012 |
5,251 |
2,239 |
74.34% |
15.65% |
| Table 1 |
The stock price data for the Sustainable Energy portfolio are in Table 2, below.
| Sustainable Energy Portfolio – Stock Prices |
| Item |
Company |
Symbol |
12/21/12 |
09/21/17 |
Delta |
Delta % |
| 1 |
Cree |
CREE |
34.0 |
24.6 |
-9.37 |
-27.56% |
| 2 |
First Solar |
FSLR |
31.0 |
48.8 |
17.76 |
57.29% |
| 3 |
GT Adv. Tech. |
GTAT |
3.0 |
0.0 |
-2.98 |
-99.33% |
| 4 |
Lighting Science |
LSCG |
0.8 |
0.0 |
-0.73 |
-97.19% |
| 5 |
Next Era Energy |
NEE |
70.0 |
146.8 |
76.78 |
109.69% |
| 6 |
Sun Power |
SPWR |
5.4 |
7.4 |
1.94 |
35.73% |
| 7 |
Solazyme |
SZYM |
8.3 |
2.2 |
-6.19 |
-74.22% |
| 8 |
Vestas |
VWS |
6.3 |
90.1 |
83.74 |
1327.10% |
| |
Note that GTATno longer exists |
| Table 2 |
The stock price data for the Fossil Fuel Portfolio are in Table 3, below.
| Fossil Fuel Portfolio – Stock Prices |
| Item |
Company |
Symbol |
12/21/12 |
09/21/17 |
Delta |
Delta % |
| 1 |
BP |
BP |
42.1 |
37.7 |
-4.42 |
-10.49% |
| 2 |
Chevron Texaco |
CVX |
109.7 |
116.5 |
6.76 |
6.16% |
| 3 |
Conoco Philips |
COP |
58.6 |
48.7 |
-9.91 |
-16.91% |
| 4 |
Exxon Mobil |
XOM |
87.2 |
79.9 |
-7.34 |
-8.41% |
| 5 |
Royal Dutch Shell |
RDS.A |
69.3 |
59.0 |
-10.28 |
-14.84% |
| 6 |
Haliburton |
HAL |
34.7 |
37.9 |
3.19 |
9.19% |
| 7 |
Transocean |
RIG |
45.6 |
9.1 |
-36.56 |
-80.11% |
| 8 |
Peabody Coal |
BTU |
395.3 |
0.0 |
-395.25 |
-100.00% |
| Table 3 |
The valuation data for the Sustainable Energy Portfolio are in Table 4, below.
| Sustainable Energy Portfolio – Valuation |
| |
|
|
Value |
Delta |
| Item |
Company |
Symbol |
12/21/12 |
09/21/17 |
Delta |
Delta % |
| 1 |
Cree |
CREE |
1,000 |
724 |
-276 |
-27.56% |
| 2 |
First Solar |
FSLR |
1,000 |
1,573 |
573 |
57.29% |
| 3 |
GT Adv. Tech. |
GTAT |
1,000 |
7 |
-993 |
-99.33% |
| 4 |
Lighting Science |
LSCG |
1,000 |
28 |
-972 |
-97.19% |
| 5 |
Next Era Energy |
NEE |
1,000 |
2,097 |
1,097 |
109.69% |
| 6 |
Sun Power |
SPWR |
1,000 |
1,357 |
357 |
35.73% |
| 7 |
Solazyme |
SZYM |
1,000 |
258 |
-742 |
-74.22% |
| 8 |
Vestas |
VWS |
1,000 |
14,271 |
13,271 |
1327.10% |
| |
total |
|
8,000 |
20,315 |
12,315 |
153.94% |
| Values in thousands. |
| Table 4 |
The valuation data for the Fossil Fuel Portfolio are in Table 5, below.
| Fossil Fuel Portfolio – Valuations |
| |
|
|
Value |
Delta |
| Item |
Company |
Symbol |
12/21/12 |
09/21/17 |
Amount |
Per Cent |
| 1 |
BP |
BP |
1,000 |
895 |
-105 |
-10.49% |
| 2 |
Chevron Texaco |
CVX |
1,000 |
1,062 |
62 |
6.16% |
| 3 |
Conoco Philips |
COP |
1,000 |
831 |
-169 |
-16.91% |
| 4 |
Exxon Mobil |
XOM |
1,000 |
916 |
-84 |
-8.41% |
| 5 |
Royal Dutch Shell |
RDS.A |
1,000 |
852 |
-148 |
-14.84% |
| 6 |
Haliburton |
HAL |
1,000 |
1,092 |
92 |
9.19% |
| 7 |
Transocean |
RIG |
1,000 |
199 |
-801 |
-80.11% |
| 8 |
Peabody Coal |
BTU |
1,000 |
0 |
-1000 |
-100.00% |
| |
total |
|
8,000 |
5,846 |
-2154 |
-26.93% |
| Values in thousands. |
| Table 5 |
The market capitalization data for the Sustainable Energy Portfolio are in Table 6.
| Sustainable Energy Portfolio |
| Market Capitalization (Billions) |
| Item |
Company |
12/21/12 |
09/21/17 |
Delta |
Delta % |
| 1 |
Cree |
3.90 |
2.41 |
-1.49 |
-38.21% |
| 2 |
First Solar |
2.69 |
5.09 |
2.4 |
89.22% |
| 3 |
GT Adv. Tech. |
0.36 |
0.00 |
-0.35 |
-98.88% |
| 4 |
Lighting Science |
0.15 |
0.00 |
-0.15 |
-100.00% |
| 5 |
Next Era Energy |
29.60 |
68.87 |
39.27 |
132.67% |
| 6 |
Sun Power |
0.88 |
1.03 |
0.15 |
17.33% |
| 7 |
Solazyme |
0.52 |
0.18 |
-0.34 |
-64.72% |
| 8 |
Vestas |
1.48 |
19.48 |
18 |
1216.22% |
| |
total |
39.58 |
97.07 |
57.49 |
145.26% |
| Table 6 |
The market capitalization data for the Fossil Fuel Portfolio are in Table 7.
| Fossil Fuel Portfolio – Market Capitalization |
| Market Capitalization (Billions) |
| Item |
Company |
12/21/12 |
09/21/17 |
Delta |
Delta % |
| 1 |
BP |
133.8 |
124.11 |
-9.69 |
-7.24% |
| 2 |
Chevron Texaco |
214.7 |
220.71 |
6.01 |
2.80% |
| 3 |
Conoco Philips |
71.2 |
59.26 |
-11.94 |
-16.77% |
| 4 |
Exxon Mobil |
397.7 |
338.50 |
-59.2 |
-14.89% |
| 5 |
Royal Dutch Shell |
216.8 |
245.19 |
28.39 |
13.10% |
| 6 |
Haliburton |
32.2 |
37.90 |
5.7 |
17.70% |
| 7 |
Transocean |
16.4 |
3.55 |
-12.85 |
-78.35% |
| 8 |
Peabody Coal |
6.37 |
0.00 |
-6.37 |
-100.00% |
| |
total |
1089.2 |
1029.22 |
-59.95 |
-5.50% |
| Table 7 |
The market capitalization data for the Big Oil portion of the Fossil Fuel Portfolio are in Table 8.
| Big Oil Portfolio – Market Capitalization |
| Market Capitalization (Billions) |
| Item |
Company |
12/21/12 |
09/21/17 |
Delta |
Delta % |
| 1 |
BP |
133.8 |
124.1 |
-9.69 |
-7.24% |
| 2 |
Chevron Texaco |
214.7 |
220.7 |
6.01 |
2.80% |
| 3 |
Conoco Philips |
71.2 |
59.3 |
-11.94 |
-16.77% |
| 4 |
Exxon Mobil |
397.7 |
338.5 |
-59.2 |
-14.89% |
| 5 |
Royal Dutch Shell |
216.8 |
245.2 |
28.39 |
13.10% |
| |
total |
1034.2 |
987.8 |
-46.43 |
-4.49% |
| Table 8 |
–
Posts in this series:
- L. Furman, 12/21/12, Popular Logistics Sustainable Energy Portfolio
- L. Furman, 2/8/13, Nega-Watts, Nega-Fuel-Watts, Mega-Bucks
- L. Furman, 2/9/13, Gold Bricks and Sink-Holes – The Risk & Reward of Fossil Fuel, Solar & Wind
- L. Furman, 3/2/13, Sustainable Energy Portfolio UP 16% & Fossil Fuel Portfolio Up 1.7% – Since Dec.21, 2012
- L. Furman, 3/23/13, Portfolio Simulation At 3 Months: Sustainable Energy: Up 22%. Fossil Fuels: 3%
- L. Furman, 4/26/13, Earth Day, 2013. Oil Spills, Explosions, Fracking Business As Usual & The Stock Market Response
- L. Furman, 5/13/13, Popular Logistics Energy Portfolios: The Trend Continues.
- L. Furman, 6/24/13, Popular Logistics Energy Portfolios: At 6 months
- L. Furman, 7/22/13, Popular Logistics Energy Portfolios: Sustainable Energy Doubles. Fossil Fuels increase 5.4%
- L. Furman, 8/22/13, Popular Logistics Energy Portfolios: An Exercise in Climate Capitalism
- L. Furman, 9/20/13, Energy Portfolios – Investing for the Future
- L. Furman, 10/21/13, Sustainable Investing – Green Energy, Green Economy
- L. Furman, 11/22/13, Energy Portfolios: Minor Corrections, Overall Results In Line With the Trend
- L. Furman, 12/23/13, Energy Portfolios at One Year Sustainable Energy up 140%. Fossil Fuels up 9.85%
- L. Furman, 12/26/13, Energy Portfolios and Reference Indices, 2013 Summary.
- L. Furman, 1/22/14, Energy Portfolios: 13 Months, Sustainable Energy up 167.4%, Fossil Fuels up 9.44%
- L. Furman, 2/24/14, Energy Portfolios: 14 Months: Sustainable Energy up 184.4%, Fossil Fuels up 8.7%
- L. Furman, 3/23/14, Energy Portfolios: 15 Months: Sustainable Energy up 222.6, Fossil Fuel up 7.3%
- L. Furman, 4/22/14, Energy Portfolios, 16 Months: Sustainable Energy up 204.25%, Fossil Fuel up 15.38%
- L. Furman, 5/21/14, Energy Portfolios, 17 Months: Sustainable Energy up 211.6%, Fossil Fuels up 18.5%
- L. Furman, 6/24/14, Energy Portfolios, 18 Months: Sustainable Energy up 257%, Fossil Fuels up 24.6%
- L. Furman, 6/26/14, Energy Portfolios: 18 Months, Analysis
- L. Furman, 7/22/14, Energy Portfolios: 19 Months: Sustainable Energy up 222%, Fossil Fuels up 25%
- L. Furman, 8/23/14, Energy Portfolios: 20 Months: Sustainable Energy up 229%, Fossil Fuels up 18.4%
- L. Furman, 8/29 /14, Energy Portfolios: 20 Months: Conclusion & Observations
- L. Furman, 10/1/14, The Paradigm Is Shifting; Fossil Fuels Are Becoming Fossils
- L. Furman, 10/7/14, Cree: Strong Financials, But …
- L. Furman, 10/21/14, Energy Portfolios: 22 Months: Sustainable Energy Up But Dropping.
- L. Furman, 11/27/14, Energy Portfolios: 23 Months: Sustainable Energy DOUBLED, Fossil Fuel Down (slightly).
- L. Furman, 12/28/14, Energy Portfolios: 24 Months: Sustainable Energy Up 91%, Fossil Fuel DOWN 10%.
- L. Furman, 1/27/15, Energy Portfolios: 2 Years, 1 Month, Sustainable Up 85%, Fossil Fuels DOWN 15%
- L. Furman, 2/23/15, Energy Portfolios: 2 Years, 2 Months, Sustainable Up 109%, Fossil Fuels DOWN 12%.
- L. Furman, 3/21,15, Energy Portfolios, 2 Years 3 Months: Sustainable up 128%, Fossil Fuel DOWN 16%.
- L. Furman, 4/21/15, Energy Portfolios, 2 Years 4 Months: Sustainable up 138%, Fossil Fuel DOWN 12%.
- L. Furman, 5/21/15, Energy Portfolios, 2 Years 5 Months: Sustainable up 137%, Fossil Fuel DOWN 13.7%.
- L. Furman, 6/21/15, Energy Portfolios, 2 Years 6 Months: Sustainable up 128%, Fossil Fuel DOWN 18%.
- L. Furman, 7/23/15, Energy Portfolios, 2 Years 7 Months: Sustainable up 121%, Fossil Fuel DOWN 24%.
- L. Furman, 8/22/15, Energy Portfolios, 2 Years 8 Months: Sustainable up 102%, Fossil Fuel DOWN 34.3%.
- L. Furman, 8/26/15, Energy Portfolios and “The Correction“.
- L. Furman, 10/1/15, Energy Portfolios, 2 Years 9 Months: Sustainable up 111.3%, Fossil Fuels DOWN 33.5%.
- L. Furman, 10/22/15, Energy Portfolios, 2 Years 10 Months: Sustainable Energy Up 125%, Fossil Fuel DOWN 27%.
- L. Furman, 11/23/15, Energy Portfolios, 2 Years 11 Months: Sustainable Energy Up 129%, Fossil Fuel DOWN 29.6%.
- L. Furman, 12/22/15, Energy Portfolios, 3 Years: Sustainable Energy up 166.6%, Fossil Fuel DOWN 36.2%
- L. Furman, 1/26/16, Energy Portfolios, 3 Years, 1 Month: Sustainable Energy UP 135.6%, Fossil Fuels DOWN 42.8%.
- L. Furman, 2/22/16, Energy Portfolios, 3 Years, 2 Months: Sustainable Energy Up 139.5%, Fossil Fuels DOWN 40.7%.
- L. Furman, 3/24/16, Energy Portfolios, 3 Years, 3 Months: Sustainable Energy Up 159.7%, Fossil Fuels DOWN 33.2%.
- L. Furman, 4/22/16, Energy Portfolios, 3 Years, 4 Months: Sustainable Energy Up 139%, Fossil Fuels DOWN 29.3%.
- L. Furman, 5/22/16, Energy Portfolios, 3 Years, 5 Months, Sustainable Energy Up 122%, Fossil Fuels Down 30%.
- L. Furman, 8/20/16, Energy Portfolios, 3 Years, 6 Months: Sustainable Energy Up 139%, Fossil Fuels DOWN 29.3%.
- L. Furman, 8/20/16, Energy Portfolios, 3 Years, 7 Months: Sustainable Energy Up 125%, Fossil Fuels DOWN 26%.
- L. Furman, 8/22/16, Energy Portfolios, 3 Years, 8 Months: Sustainable Energy Up 138%, Fossil Fuels DOWN 27%.
- L. Furman, 9/26/16, Energy Portfolios, 3 Years, 9 Months: Sustainable Energy up 133.5%, Fossil Fuels Down 31%.
- L. Furman, 10/23/16, Energy Portfolios, 3 Years, 10 Months: Sustainable Energy up 130%, Fossil Fuels Down 26%
- L. Furman, 11/25/16, Energy Portfolios, 3 Years, 11 Months: Sustainable Energy up 93%, Fossil Fuels Down 20%
- L. Furman, 1/1/17, Energy Portfolios: 4 Years: Sustainable Energy up 130%, Fossil Fuels Down 26%
- L. Furman, 1/23/17, Energy Portfolios: 4 Years, 1 Month: Sustainable Energy Effectively Doubled, Fossil Fuels Down 18.3%.
- L. Furman, 3/5/17, Energy Portfolios: 4 Years, 2 Months: Sustainable Energy up 117.25%, Fossil Fuel Down 33.99%
- L. Furman, 4/23/17, Energy Portfolios: 4 Years, 3 Months: Sustainable Energy up 120.9%, Fossil Fuel Down 25.05%
- L. Furman, 4/23/17, Energy Portfolios, 4 Years, 4 Months: Sustainable Energy Up 126.7%, Fossil Fuel DOWN 26.9%
- L. Furman, 5/26/17, Energy Portfolios, 4 Years, 5 Months: Sustainable Energy Up 148.4%, Fossil Fuel DOWN 24.9%
- L. Furman, 6/25/17, Energy Portfolios, 4 Years, 6 Months: Sustainable Energy Up 148.4%, Fossil Fuel DOWN 24.9%
- L. Furman, 7/22/17, Energy Portfolios, 4 Years, 7 Months: Sustainable Energy Up 170.8%, Fossil Fuel DOWN 29.3%
- L. Furman, 9/24/17, Energy Portfolios, 4 Years, 8 Months: Sustainable Energy Up 170.8%, Fossil Fuel DOWN 29.3%
- L. Furman, 9/25/17, Energy Portfolios, 4 Years, 9 Months: Sustainable Energy Up 153.94%, Fossil Fuel DOWN 26.93%
–
A co-founder of Popular Logistics, I hold an MBA in “Managing for Sustainability” from Marlboro College and a Bachelor’s of Science in Biology from the City University of New York College of Staten Island. Available as a speaker and consultant, I can be reached at “Popular Logistics . com” as “L Furman.”


 On Dec. 21, 2012, I imagined $16 Million dollars in equal investments in 16 real energy companies; eight Sustainable Energy companies and eight fossil fuel companies. Excluding the value of dividends and transaction costs, but including the bankruptcy or crash of three companies in the sustainable energy space.