Category Archives: Eaarth

COP 21 – the Future Began Yesterday

globe_west_540

Earth, The Blue Marble, courtesy NASA

COP 21 is, perhaps, the most important international effort in history. It concluded with an agreement by 196 nations to limit CO2 emissions to hold global temperature rise to 1.5 degrees Centigrade or 3.3 degrees Fahrenheit (NPR).

The only way to do this is to phase out fossil fuels, quickly, and replace them with efficient use of sustainable energy systems, i.e., solar, wind, geothermal, hydro, and insulation.

Continue reading

Jersey Shore 350.org:Tues. 9/3/13, Stay Gold Cafe, Belmar, NJ, 6:00 PM

Jersey Shore Damage from Hurricane Sandy. U.S. Air Force photo by Master Sgt. Mark C. Olsen

Jersey Shore Damage from Hurricane Sandy. U.S. Air Force photo by Master Sgt. Mark C. Olsen

Approximately 97% of climate scientists agree that climate-warming trends over the past century are very likely due to human activities, which have increased atmospheric CO2 from roughly 265 parts per million, PPM, in 1800 to 400 PPM today. Many of these scientists and climate experts agree we must reduce the amount of CO2 in the atmosphere from current levels to below 350 PPM.

Along with climate-warming comes extreme weather, and events like Hurricane Irene, 2011, Hurricane Sandy, 2012. 350 Jersey Shore aims to inform New Jersey residents of our climate challenges, and provide solutions to help reduce carbon emissions locally and beyond.

Organized by Stephen Fowler of Echo Movement, 350 Jersey Shore, an arm of 350.0rg is meeting on Tuesday, Sept. 3, 2013 at 6:00 PM at the Stay Gold Cafe, Belmar, NJ. ( Event Link )

Atmospheric CO2: 400 PPM on May 9, 2013

Atmospheric CO2, Measured at Mauna Loa, 1960 - Present

Atmospheric CO2, Measured at Mauna Loa, 1960 – Present

Atmospheric CO2 hit 400 PPM on Thursday, May 9, 2013, as measured at the Koana Loa observatory. This is an increase of 85 ppm, 26.98%, from 1960. This is why Bill McKibben, of 350.org, calls our planet Eaarth. It’s weather, climate, and ecology are different than the one those of us who are over 30 – or over 12 – were born on.  National Geographic, summed it up well,  here:

“Greenhouse gas highest since the Pliocene, when sea levels were higher and the Earth was warmer.” 

The scientists are taking the data – increased atmospheric carbon dioxide – and asking two questions:

  1. Why is it increasing?
  2. What are the likely effects?

The journalists and bloggers, like Geoffrey Lean, at the Telegraph, asks, here, “Did the contentious global warming ‘hockey stick’ graph get it right?”  He could have asked “Did the scientists – and the environmentalists – get it right?  And if so, shouldn’t we stop burning fossil fuels?” 

Continue reading

Forget the Great Wall – Meet The Great Haze

Beijing from space, courtesy NASA

Image 1. Beijing from space, Jan., 2013, courtesy NASA

忘了长城 – 我们现在有大的雾度

“Forget the Great Wall – We Now Have the Great Haze”

– Translation by Google

In the 1960’s and 1970’s astronauts showed that we could see the Great Wall of China from space. Today, it’s the Great Haze of China that we can see from space .  The New York Daily News, here, published this image, taken by NASA in January 12, 2013 (here) when the Air Quality Index, AQI, reached 775.

The AQI was established by the US EPA. AQI above 300 is considered dangerous. AQI at 775 is probably deadly.

Continue reading

Earth Day, 2012 or Eaarth Day, 2012

One of over 100 Tornadoes that hit Kansas and Oklahoma

One of over 100 Tornadoes that hit Kansas, Iowa and Oklahoma on 4/14/12

Kansas, Oklahoma, Earth Day, 2012, or Eaarth Day, cognizant of Bill McKibben’s observation that the planet on which we live is qualitatively different from the planet on which we were born.

Do you see your cup as half-full, or half-empty? Is it on a table, or a pile of rubble? And is it filled with clean water or a toxic soup?

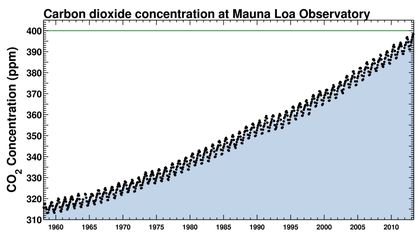
Status: Over 100 Tornadoes hit the mid-west, mostly Kansas and Oklahoma on Saturday, April 14, 2011 (NY Times). The summer of 2011 was one of the hottest, with 90 days of over 100 degrees in Austin, Texas ( National Oceanographic and Atmospheric Administration, NOAA: Data, Analysis). The winter of 2011-2012 was also one of the warmest, with records set and broken across the United States.  A thorough analysis of climate science is beyond the scope of this post, but is covered in The Rough Guide to Climate Change, The Symptoms, The Science, The Solutions, by Robert Henson, ISBN 978-1-84836-579-7, Climate Change, A Multidisciplinary Approach, by William Burroughs, ISBN978-0-521-69033-1, The Climate Fix, by Roger Pielke, Jr, ISBN 978-0-465-02519-0, and An Inconvenient Truth, by Al Gore, ISBN 1-59486-567-1, Eaarth: Making Life on a Tough New Planet, by Bill McKibben, ISBN 978-080509056-7. These are available at your local bookstore, if you have one. Many Americans now understand that our weather and climate are effected by the amount of carbon we have pumped into our atmosphere in the last 200 years (NY Times). If you don’t want to understand the analysis, tune the tv to your local climate denier station, buy a gun, some ammo, and lots of food and water.

Continue reading