Category Archives: Energy

Solar v Corn to Ethanol

Writing for “Virginia Mercury,” Ivy Main says,

What is certain is that improvements in wind, solar, battery storage and electric vehicles will continue these technologies’ march to dominance, while fossil fuels become niche. Concerns about the land needs of renewable energy are overblown; you could power the entire U.S. with solar panels on just one-third of the more than 30 million acres currently devoted to growing corn for climate-unfriendly ethanol. Indeed, solar doesn’t even have to displace farming. Agrivoltaics is already making solar and agriculture compatible and creating money-saving synergies.  

I am sure she is correct. Consider the the logistics and life cycles of the PV Solar and Corn to Ethanol systems and the Second Law of Thermodynamics. The 2nd law basically “The entropy of the universe increases.” (Entropy is randomness or disorder. And this is high school physics.)

Imagine a building w a solar roof. The sun shines on the roof, and it powers the building (except at night or when it’s raining or snowing). One stop shopping. 

Imagine a corn to ethanol operation. 

  1. Plant corn. 
  2. Apply fertilizer. 
  3. Apply pesticides. 
  4. Repeat 2 and 3 as needed. 
  5. Harvest the corn. 
  6. Process it into ethanol. 
  7. Ship the ethanol to a facility where it is mixed into gasoline. 
  8. Ship the gas-methanol mixture to gas stations. 
  9. Repeat. 

Not quite as simple. 

Solar modules generate electricity by converting photons into electric current.
Ethanol farms convert photons into corn, which must be harvested, then processed. Growing the crop probably uses fertilizer and pesticides, because the corn to ethanol operations are probably not organic farms. The tractors required for planting, harvesting, etc require fuel, maintenance. The factories in which the corn is transformed into ethanol require power and maintenance, and if they have moving parts, lubricants. Transporting the ethanol requires tankers, pipelines, etc. 
Solar is one step. Corn to ethanol is multiple steps. Entropy is created, energy is lost in each step. (Energy is also lost in solar when 1) the direct current generated by a PV solar module is inverted into DC and 2) the electricity travels thru transmission lines.)
And PV Solar works with low maintenance for 20 to 30 years. While corn to ethanol planting, harvesting, processing need to be repeated every year.

This Changes Everything … Maybe

The discovery of graphene by Andre Geim and Konstantin Novoselov, for which they won the 2010 Nobel Prize in Physics ( details at Nobel.org and at Graphene-Info) may be the most significant non-medical scientific event since the discovery or invention of the transistor in 1947. Graphene is a two-dimensional lattice of carbon – think of a flexible and one atom thick flat diamond – with very interesting physical and quantum properties.

And it may change the world.

Continue reading

Tesla, the Auto Industry, and the Oil Industry, Nov. 2021

Tesla, with a market capitalization of $1.137 Trillion at the close of trading on Friday, November 19, 2021, is worth more than GM, Ford, Honda, Toyota, BMW, Daimler Benz, VW COMBINED. 45% more.

Add in the value of Nisan, Hyundai, and Stellantis, which owns Fiat, Chrysler, Jeep, Maserati, Alfa Romeo, and other brands, and Tesla is still worth 25.8 % more than the rest of the major auto companies. See Table 1.

More surprising is that Tesla, is worth 39% more than Exxon Mobil, Shell, Conoco Philips, Chevron Texaco, and BP Amoco combined. See Table 2.

Arguably, Toyota set the stage for energy efficiency with the 1997 launch of the Prius (click here). And Fisker, launched in 2007, could have been Tesla. Coupled with the fact that other car companies are introducing electric vehicles, including the Chevy Bolt, the Ford Mustang Mach-e and the Ford F-150 Lightning, the Fisker Ocean, etc. it is clear that with Tesla, Elon Musk has changed the world.

Continue reading

The Answer My Friends, Is Blowin’ in the Wind –

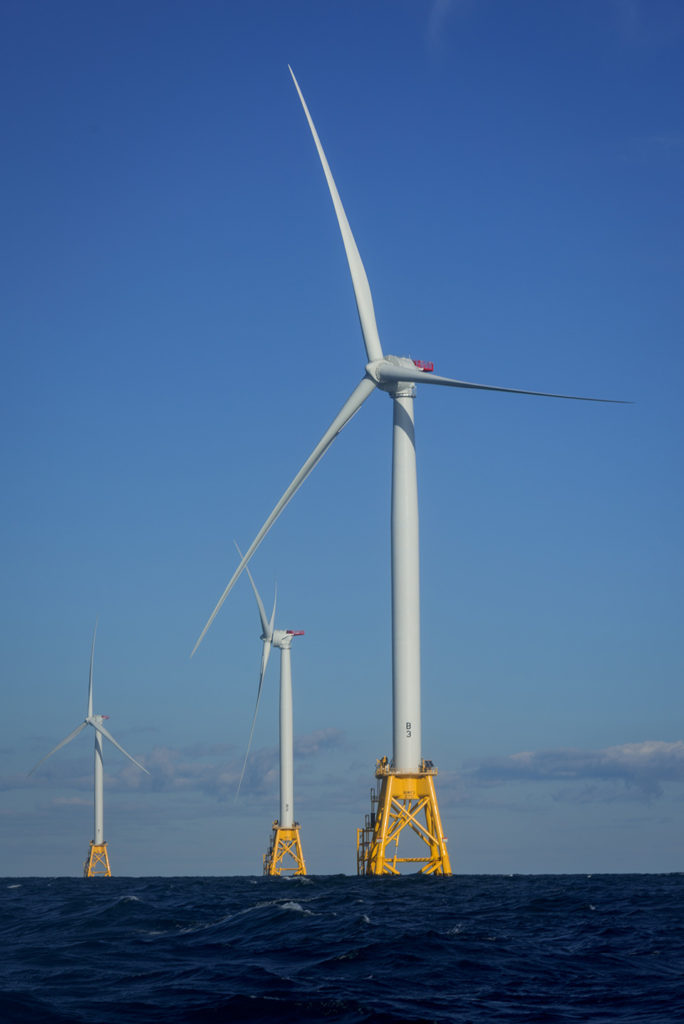
Image of Block Island Wind, off of Rhode Island

As noted in the Asbury Park Press, here, Orsted (DKK, DNNGY). with support from PSEG, will build Ocean Wind, a 1.11 GW farm about 15 miles east of Atlantic City.  “Ocean Wind” should come online in 2024. NJ’s Board of Public Utilities, BPU approved the $1.6 Billion, $1.44 per watt plan. (Press Release. Financial Information.)

That’s about twice the nameplate capacity of the Oyster Creek nuclear power plant, built in the late 1960’s and turned off in 2018, at 12.8% of the cost of new nuclear.

Back in 2008, NASA published this on Global Ocean Wind Energy Potential

Ocean Wind will power roughly 500,000 homes beginning in 2024. NJ Gov. Phil Murphy set the state’s Energy Master Plan to build 3.5 GW offshore wind to power 1.5 million homes by 2030.

Meanwhile, in Georgia, the newest nuclear power plants, the 2.234 GW Vogtle 3 and 4, the first new nuclear reactors built in the United States in 30 years, are now 6 years late and estimated to cost $28 billion. (Taxpayer.net).  That is a cost overrun of $14 billion, 100% over the initial cost of $14 billion.  (Atlanta Journal Constitution, Power).

New nuclear is 8.7 times the cost of new wind power capacity. And nuclear needs fuel, waste management, and the safety and security concerns with nuclear power can not be understated.

A co-founder of Popular Logistics, I hold an MBA in “Managing for Sustainability” from Marlboro College and a Bachelor’s of Science in Biology from the City University of New York  College of Staten Island. I also hold a PMI’s PMP and CompTIA’sNetwork+ certifications. Available as a speaker and consultant, I can be reached at “Popular Logistics . com” as “L Furman.”

Energy Portfolios, 4 Years, 11 Months: Sustainable Energy Up 108.6%, Fossil Fuel DOWN 24.3%

On Dec. 21, 2012, I put $16 Million imaginary dollars into 16 real energy companies; $8.0 in the Sustainable Energy space and $8.0 in the fossil fuel space, $1.0 Million into each. Excluding the value of dividends and transaction costs, but including the bankruptcy or crash of three companies in the sustainable energy space,

In recent months the Sustainable Energy portfolio has dropped and the Fossil Fuel portfolio has increased. However, this may prove to be a short term correction that has more to do with macro-geopolitical events emanating from Washington, DC than global macroeconomic factors.    

As of the close of trading 59 months later,

  • The Market Capitalization of the sustainable energy companies is up 148.6%, from $39.58 Billion to $98.4 Billion. (See Table 6, below).
  • The Market Capitalization of the Fossil Fuel portfolio is DOWN 3.8%, from $1.09 Trillion to $1.05 Trillion. (See Table 7, below).
  • And the Market Capitalization of the Big Oil companies is DOWN 2.6%,from $1.03 Trillion on 9/21/17 to $1.007 Trillion on 10/20/17. (See Table 8, below)

In Addition

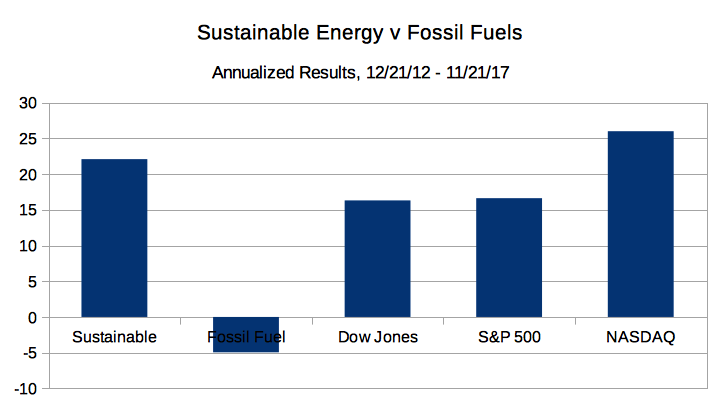
  • The Fossil Fuel portfolio went from $8.0 Million to $6.06 Million, down 24.3% overall, down 4.94% on an annualized basis.
  • The Sustainable Energy portfolio went from $8 Million to $16.7 Million, up 108.6%, overall and 22.1% on an annualized basis.
  • The Dow Jones Industrial Average is up 80.2% overall and 16.31% on an annualized basis; from 13,091 on 12/21/12 to 23,591 on 11/21/17.
  • The S&P 500 is up 81.8% overall and 16.63% on an annualized basis, from 1,430 on 12/21/12 to close at 2,599 on 11/21/17.

The details are below.

Continue reading

Energy Portfolios, 4 Years, 5 Months: Sustainable Energy Up 148.4%, Fossil Fuel DOWN 24.9%

At 4 Years, 5 Months:

  • Sustainable Energy UP 148.4%, 33.6% per year.
  • Fossil Fuel DOWN 24.9%, DOWN 5.6% per year.
  • The S&P 500 UP 66.6%, 15.1% per year. 

Portfolios1705

On Dec. 21, 2012, I put $16 Million imaginary dollars in equal imaginary investments in 16 real energy companies; $8.0 in the Sustainable Energy space and $8.0 in the fossil fuel space. Excluding the value of dividends and transaction costs, but including the bankruptcy or crash of three companies in the sustainable energy space,

As of the close of trading on May 19, 2017:

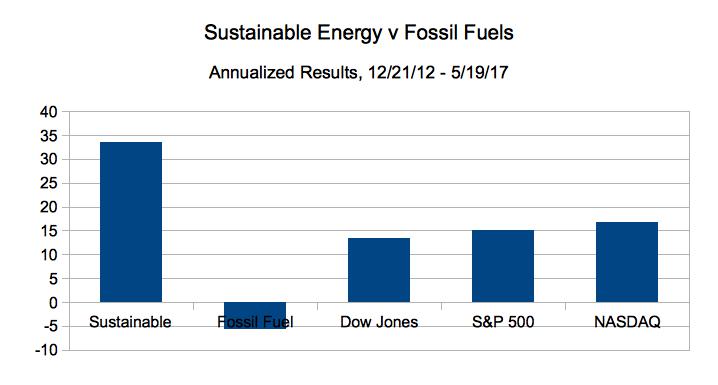
  • The Fossil Fuel portfolio went from $8.0 Million to $6.005 Million, down 24.9% overall, down 5.6% on an annualized basis.
  • The Sustainable Energy portfolio went from $8 Million to $19.87 Million, up 148.4%, overall and 33.6% on an annualized basis.
  • The Dow Jones Industrial Average is up 58.93% overall and 13.3% on an annualized basis; from 13.091 on 12/21/12 to 20,805 on 5/19/17.
  • The S&P 500 is up 66.57% overall and 15.1% on an annualized basis, from 1,430 on 12/21/12 to close at 2,382 on 4/19/17.

Continue reading

Energy Portfolios, 4 Years, 3 Months: Sustainable Energy Up 120.9%, Fossil Fuel DOWN 25.1%

Portfolios1704_html_4f901e3

On Dec. 21, 2012, I put $16 Million imaginary dollars in equal imaginary investments in 16 real energy companies; $8.0 in the Sustainable Energy space and $8.0 in the fossil fuel space. Excluding the value of dividends and transaction costs, but including the bankruptcy or crash of three companies in the sustainable energy space,

As of the close of trading on March 21, 2017:

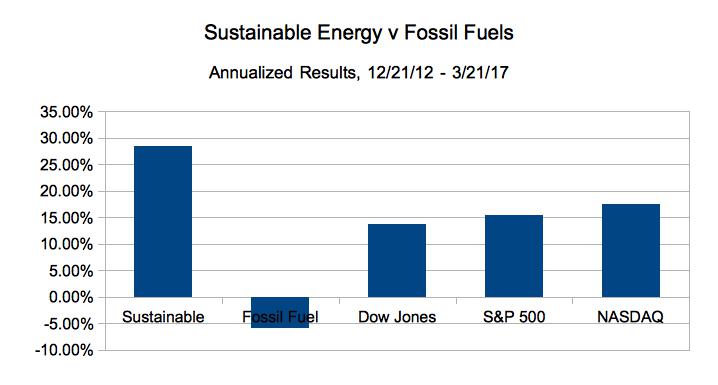
  • The Fossil Fuel portfolio went from $8.0 Million to $5.995 Million, down 25.05% overall, down 5.9% on an annualized basis.
  • The Sustainable Energy portfolio went from $8 Million to $17.7 Million, up 120.9%, overall and 28.43% on an annualized basis.
  • The Dow Jones Industrial Average is up 58.45% overall and 13.75% on an annualized basis, went from 13.091 on 12/21/12 to 20,743 on 3/21/17.
  • The S&P 500 is up 65.38% overall and 15.38% on an annualized basis, from 1,430 on 12/21/12 to close at 2,365 on 3/21/17.

Continue reading

3 Years, 9 Months: Sustainable Energy Up 134%, Fossil Fuel DOWN 31%

plp-1609

On Dec. 21, 2012, I imagined $16 Million dollars in equal investments in 16 real energy companies; eight Sustainable Energy companies and eight fossil fuel companies. Excluding the value of dividends and transaction costs, but including the bankruptcy or crash of three companies in the sustainable energy space.


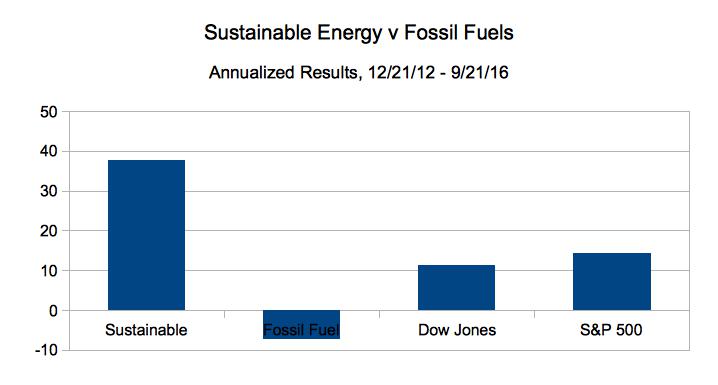
As of the close of trading on September 21, 2016:

  • The Fossil Fuel portfolio went from $8.0 Million to $5.52 Million, down 31.05% overall, down 8.3% on an annualized basis.
  • The Sustainable Energy portfolio went from $8 Million to $18.7 Million, up 133.5% overall and 35.6% on an annualized basis.
  • The Dow Jones Industrial Average went from 13.091 on 12/21/12 to 18,294, up 39.7%, overall and 10.6% on an annualized basis
  • The S&P 500 went from 1,430 on 12/21/12 to close at 2,165, up 51.3% overall and 13.7% on an annualized basis.

The Sustainable Energy portfolio is composed of Cree (CREE) and Lighting Sciences (LSCG) in the LED space, GT Advanced Tech (GTAT), which at the time made solar ovens for cooking PV wafers. First Solar (FSLR) and Sunpower Corp. (SPWR) in the solar space, Vestas (VWSYF), a wind company, Solazyme (SZYM) a biofuel company and Next Era Energy (NEE), a utility.

The fossil fuel companies are the oil companies British Petroleum (BP), Chevron Texaco (CVX), Conoco Phillips (COP), Exxon Mobil (XOM) and RD Shell (RDS.A), the coal company Peabody Coal (BTU), and Haliburton (HAL) and Transocean (RIG), companies in the offshore oil and oil and gas drilling service industries.

The data are summarized beginning in Table 1, below.

Summary Data
Portfolio 12/21/12 09/21/16 Delta Delta % Annualized
Sustainable Energy 8,000,000 18,681,471 10,681,471 133.52% 35.60%
Fossil Fuel 8,000,000 5,515,027 -2,484,973 -31.06% -8.28%
DJI 13,091 18,294 5,203 39.74% 10.60%
S&P 500 1,430 2,163 733 51.26% 13.67%
Table 1

The stock price data for the Sustainable Energy portfolio are in Table 2, below.

Sustainable Energy Portfolio – Stock Prices
Item Company Symbol 12/21/12 09/21/16 Delta Delta %
1 Cree CREE 34.0 24.6 -9.42 -27.71%
2 First Solar FSLR 31.0 34.1 3.07 9.90%
3 GT Adv. Tech. GTAT 3.0 0.0 -2.98 -99.28%
4 Lighting Science LSCG 0.8 0.1 -0.67 -89.33%
5 Next Era Energy NEE 70.0 127.8 57.84 82.63%
6 Sun Power SPWR 5.4 8.1 2.62 48.25%
7 Solazyme SZYM 8.3 2.2 -6.19 -74.22%
8 Vestas VWS 6.3 83.2 76.85 1217.91%
Note that GTAT is currently in bankruptcy protection.
Table 2

The stock price data for the Fossil Fuel Portfolio are in Table 3, below.

Fossil Fuel Portfolio – Stock Prices
Item Company Symbol 12/21/12 09/21/16 Delta Delta %
1 BP BP 42.1 33.6 -8.51 -20.20%
2 Chevron Texaco CVX 109.7 99.6 -10.08 -9.19%
3 Conoco Philips COP 58.6 40.1 -18.54 -31.64%
4 Exxon Mobil XOM 87.2 83.3 -3.93 -4.51%
5 Royal Dutch Shell RDS.A 69.3 48.0 -21.30 -30.74%
6 Haliburton HAL 34.7 42.7 8.02 23.11%
7 Transocean RIG 45.6 9.1 -36.51 -80.00%
8 Peabody Coal BTU 395.3 1.6 -393.67 -99.60%
Table 3

The valuation data for the Sustainable Energy Portfolio are in Table 4, below.

Sustainable Energy Portfolio – Valuation
    Value Delta
Item Company Symbol 12/21/12 09/21/16 Delta Delta %
1 Cree CREE 1,000 723 -277 -27.71%
2 First Solar FSLR 1,000 1,099 99 9.90%
3 GT Adv. Tech. GTAT 1,000 7 -993 -99.28%
4 Lighting Science LSCG 1,000 107 -893 -89.33%
5 Next Era Energy NEE 1,000 1,826 826 82.63%
6 Sun Power SPWR 1,000 1,483 483 48.25%
7 Solazyme SZYM 1,000 258 -742 -74.22%
8 Vestas VWS 1,000 13,179 12,179 1217.91%
total 8,000 18,681 10,681 133.52%
Values in thousands.
Table 4

The valuation data for the Fossil Fuel Portfolio are in Table 5, below.

Fossil Fuel Portfolio – Valuations
Value Delta
Item Company Symbol 12/21/12 09/21/16 Amount Per Cent
1 BP BP 1,000 798 -202 -20.20%
2 Chevron Texaco CVX 1,000 908 -92 -9.19%
3 Conoco Philips COP 1,000 684 -316 -31.64%
4 Exxon Mobil XOM 1,000 955 -45 -4.51%
5 Royal Dutch Shell RDS.A 1,000 693 -307 -30.74%
6 Haliburton HAL 1,000 1,231 231 23.11%
7 Transocean RIG 1,000 200 -800 -80.00%
8 Peabody Coal BTU 1,000 4 -996 -99.59%
total 8,000 5,472 -2528 -31.60%
Values in thousands.
Table 5

The market capitalization data for the Sustainable Energy Portfolio are in Table 6.

Sustainable Energy Portfolio
Market Capitalization (Billions)
Item Company 12/21/12 09/21/16 Delta Delta %
1 Cree 3.90 2.54 -1.36 -34.87%
2 First Solar 2.69 3.52 0.83 30.86%
3 GT Adv. Tech. 0.36 0.00 -0.353 -98.88%
4 Lighting Science 0.15 0.00 -0.153 -100.00%
5 Next Era Energy 29.60 60.67 31.07 104.97%
6 Sun Power 0.88 1.13 0.2521 28.72%
7 Solazyme 0.52 0.18 -0.3357 -64.72%
8 Vestas 1.48 18.42 16.94 1144.59%
total 39.58 86.467 46.8904 118.48%
Table 6

The market capitalization data for the Fossil Fuel Portfolio are in Table 7.

Fossil Fuel Portfolio – Market Capitalization
Market Capitalization (Billions)
Item Company 12/21/12 09/21/16 Delta Delta %
1 BP 133.8 108.75 -25.05 -18.72%
2 Chevron Texaco 214.7 192.42 -22.28 -10.38%
3 Conoco Philips 71.2 52.04 -19.16 -26.91%
4 Exxon Mobil 397.7 349.48 -48.22 -12.12%
5 Royal Dutch Shell 216.8 204.67 -12.13 -5.60%
6 Haliburton 32.2 38.22 6.02 18.70%
7 Transocean 16.4 3.61 -12.79 -77.99%
8 Peabody Coal 6.37 0.03 -6.342 -99.56%
total 1089.2 949.22 -139.952 -12.85%
Table 7

The market capitalization data for the Big Oil portion of the Fossil Fuel Portfolio are in Table 8.

Big Oil Portfolio – Market Capitalization
Market Capitalization (Billions)
Item Company 12/21/12 09/21/16 Delta Delta %
1 BP 133.8 108.8 -25.05 -18.72%
2 Chevron Texaco 214.7 192.4 -22.28 -10.38%
3 Conoco Philips 71.2 52.0 -19.16 -26.91%
4 Exxon Mobil 397.7 349.5 -48.22 -12.12%
5 Royal Dutch Shell 216.8 204.7 -12.13 -5.60%
total 1034.2 907.4 -126.84 -12.26%
Table 8

  1. L. Furman, 12/21/12, Popular Logistics Sustainable Energy Portfolio
  2. L. Furman, 2/8/13, Nega-Watts, Nega-Fuel-Watts, Mega-Bucks
  3. L. Furman, 2/9/13, Gold Bricks and Sink-Holes – The Risk & Reward of Fossil Fuel, Solar & Wind
  4. L. Furman, 3/2/13, Sustainable Energy Portfolio UP 16% & Fossil Fuel Portfolio Up 1.7% – Since Dec.21, 2012
  5. L. Furman, 3/23/13, Portfolio Simulation At 3 Months: Sustainable Energy: Up 22%. Fossil Fuels: 3%
  6. L. Furman, 4/26/13, Earth Day, 2013. Oil Spills, Explosions, Fracking Business As Usual & The Stock Market Response
  7. L. Furman, 5/13/13, Popular Logistics Energy Portfolios: The Trend Continues.
  8. L. Furman, 6/24/13, Popular Logistics Energy Portfolios: At 6 months
  9. L. Furman, 7/22/13, Popular Logistics Energy Portfolios: Sustainable Energy Doubles. Fossil Fuels increase 5.4%
  10. L. Furman, 8/22/13, Popular Logistics Energy Portfolios: An Exercise in Climate Capitalism
  11. L. Furman, 9/20/13, Energy Portfolios – Investing for the Future
  12. L. Furman, 10/21/13, Sustainable Investing – Green Energy, Green Economy
  13. L. Furman, 11/22/13, Energy Portfolios: Minor Corrections, Overall Results In Line With the Trend
  14. L. Furman, 12/23/13, Energy Portfolios at One Year Sustainable Energy up 140%. Fossil Fuels up 9.85%
  15. L. Furman, 12/26/13, Energy Portfolios and Reference Indices, 2013 Summary.
  16. L. Furman, 1/22/14, Energy Portfolios: 13 Months, Sustainable Energy up 167.4%, Fossil Fuels up 9.44%
  17. L. Furman, 2/24/14, Energy Portfolios: 14 Months: Sustainable Energy up 184.4%, Fossil Fuels up 8.7%
  18. L. Furman, 3/23/14, Energy Portfolios: 15 Months: Sustainable Energy up 222.6, Fossil Fuel up 7.3%
  19. L. Furman, 4/22/14, Energy Portfolios, 16 Months: Sustainable Energy up 204.25%, Fossil Fuel up 15.38%
  20. L. Furman, 5/21/14, Energy Portfolios, 17 Months: Sustainable Energy up 211.6%, Fossil Fuels up 18.5%
  21. L. Furman, 6/24/14, Energy Portfolios, 18 Months: Sustainable Energy up 257%, Fossil Fuels up 24.6%
  22. L. Furman, 6/26/14, Energy Portfolios: 18 Months, Analysis
  23. L. Furman, 7/22/14, Energy Portfolios: 19 Months: Sustainable Energy up 222%, Fossil Fuels up 25%
  24. L. Furman, 8/23/14, Energy Portfolios: 20 Months: Sustainable Energy up 229%, Fossil Fuels up 18.4%
  25. L. Furman, 8/29 /14, Energy Portfolios: 20 Months: Conclusion & Observations
  26. L. Furman, 10/1/14, The Paradigm Is Shifting; Fossil Fuels Are Becoming Fossils
  27. L. Furman, 10/7/14, Cree: Strong Financials, But … 
  28. L. Furman, 10/21/14, Energy Portfolios: 22 Months: Sustainable Energy Up But Dropping.
  29. L. Furman, 11/27/14, Energy Portfolios: 23 Months: Sustainable Energy DOUBLED, Fossil Fuel Down (slightly).
  30. L. Furman, 12/28/14, Energy Portfolios: 24 Months: Sustainable Energy Up 91%, Fossil Fuel DOWN 10%.
  31. L. Furman, 1/27/15, Energy Portfolios: 2 Years, 1 Month, Sustainable Up 85%, Fossil Fuels DOWN 15%
  32. L. Furman, 2/23/15, Energy Portfolios: 2 Years, 2 Months, Sustainable Up 109%, Fossil Fuels DOWN 12%.
  33. L. Furman, 3/21,15, Energy Portfolios, 2 Years 3 Months: Sustainable up 128%, Fossil Fuel DOWN 16%.
  34. L. Furman, 4/21/15, Energy Portfolios, 2 Years 4 Months: Sustainable up 138%, Fossil Fuel DOWN 12%.
  35. L. Furman, 5/21/15, Energy Portfolios, 2 Years 5 Months: Sustainable up 137%, Fossil Fuel DOWN 13.7%.
  36. L. Furman, 6/21/15, Energy Portfolios, 2 Years 6 Months: Sustainable up 128%, Fossil Fuel DOWN 18%.
  37. L. Furman, 7/23/15, Energy Portfolios, 2 Years 7 Months: Sustainable up 121%, Fossil Fuel DOWN 24%.
  38. L. Furman, 8/22/15, Energy Portfolios, 2 Years 8 Months: Sustainable up 102%, Fossil Fuel DOWN 34.3%.
  39. L. Furman, 8/26/15, Energy Portfolios and “The Correction“.
  40. L. Furman, 10/1/15, Energy Portfolios, 2 Years 9 Months: Sustainable up 111.3%, Fossil Fuels DOWN 33.5%.
  41. L. Furman, 10/22/15, Energy Portfolios, 2 Years 10 Months: Sustainable Energy Up 125%, Fossil Fuel DOWN 27%.
  42. L. Furman, 11/23/15, Energy Portfolios, 2 Years 11 Months: Sustainable Energy Up 129%, Fossil Fuel DOWN 29.6%.
  43. L. Furman, 12/22/15, Energy Portfolios, 3 Years: Sustainable Energy up 166.6%, Fossil Fuel DOWN 36.2%
  44. L. Furman, 1/26/16, Energy Portfolios, 3 Years, 1 Month: Sustainable Energy UP 135.6%, Fossil Fuels DOWN 42.8%.
  45. L. Furman, 2/22/16, Energy Portfolios, 3 Years, 2 Months: Sustainable Energy Up 139.5%, Fossil Fuels DOWN 40.7%.
  46. L. Furman, 3/24/16, Energy Portfolios, 3 Years, 3 Months: Sustainable Energy Up 159.7%, Fossil Fuels DOWN 33.2%.
  47. L. Furman, 4/22/16, Energy Portfolios, 3 Years, 4 Months: Sustainable Energy Up 139%, Fossil Fuels DOWN 29.3%.
  48. L. Furman, 5/22/16, Energy Portfolios, 3 Years, 5 Months, Sustainable Energy Up 122%, Fossil Fuels Down 30%.
  49. L. Furman, 8/20/16, Energy Portfolios, 3 Years, 6 Months: Sustainable Energy Up 139%, Fossil Fuels DOWN 29.3%.
  50. L. Furman, 8/20/16, Energy Portfolios, 3 Years, 7 Months: Sustainable Energy Up 125%, Fossil Fuels DOWN 26%.
  51. L. Furman, 8/22/16, Energy Portfolios, 3 Years, 8 Months: Sustainable Energy Up 138%, Fossil Fuels DOWN 27%.
  52. L. Furman, 9/26/16, Energy Portfolios, 3 Years, 9 Months, Sustainable Energy up 133.5%, Fossil Fuels Down 31%.

A co-founder of Popular Logistics, I hold a BS and an MBA in “Managing for Sustainability” from Marlboro College, and over 20 years experience in Information Technology. Available as a speaker and consultant, I can be reached at “Popular Logistics . com” as “L Furman.”

Energy Portfolios: 3 Years, 6 Months: Sustainable Energy Up 125.2%, Fossil Fuel DOWN 25.98%

PLPort.1606

On Dec. 21, 2012, I imagined $16 Million dollars in equal investments in 16 real energy companies; $1.0 M in each company in each of eight companies in the Sustainable Energy space and $1.0 M each of eight companies in the fossil fuel space. Excluding the value of dividends and transaction costs, but including the bankruptcy or crash of various companies in the sustainable energy space and coal industry.

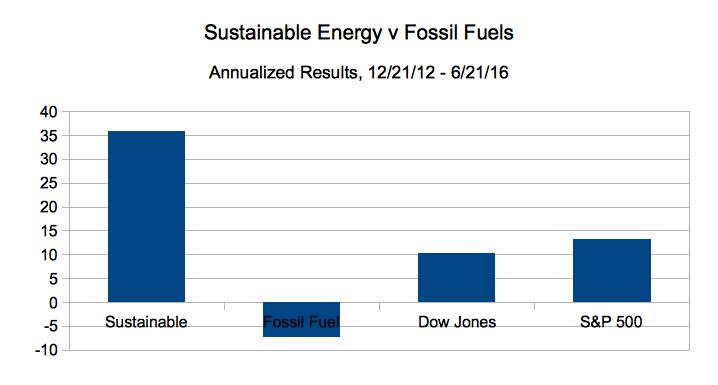
As of the close of trading on June 21, 2016:

  • The Fossil Fuel portfolio went from $8.0 Million to $5.92 Million, down 25.98% overall, and 7.4% on an annualized basis.
  • The Sustainable Energy portfolio went from $8 Million to $18.019 Million, up 125.24%, overall and 35.8% on an annualized basis.
  • The Dow Jones Industrial Average is up 36.2% overall and 10.3% on an annualized basis, went from 13.091 on 12/21/12 to 17,501 on 6/21/16.
  • The S&P 500 is up 446.08% overall and 13.2% on an annualized basis, from 1,430 on 12/21/12 to close at 2089 on 6/21/16.

Continue reading

Energy Portfolios, 3 Years, 4 Months: Sustainable Energy Up 139%, Fossil Fuel DOWN 29.3%

PL_Port.40On Dec. 21, 2012, I put $16 Million imaginary dollars in equal imaginary investments in 16 real energy companies; $8.0 in the Sustainable Energy space and $8.0 in the fossil fuel space. Excluding the value of dividends and transaction costs, but including the bankruptcy or crash of three companies in the sustainable energy space, and one company in the fossil fuel space.
The big news this month is the bankruptcy filing of Peabody Coal (Bloomberg, here). Continue reading

Drilling for Oil off the Jersey Shore – Forget About It

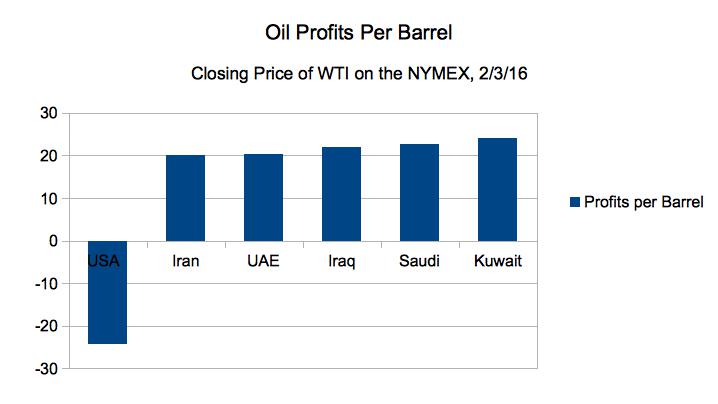
Oil_ProfitsDeepwater Drilling Offshore of the US yields oil at $57 per barrel (see note 1) and, according to Forbes, the Break-Even price is $65 per barrel. It makes no sense to drill deepwater wells offshore of the US with WTI crude oil under $35 per barrel And given that the costs to produce a barrel of oil in the Middle East, range from $8.50 in Kuwait to $9.90 in Saudi Arabia, to $12.60 in Iran WE CAN’T COMPETE!

But we shouldn’t bother. We should move to a post fossil fuel economy.

Continue reading

BEIJING, CHINA - JANUARY 23: A tourist and her daughter wearing the masks visit the Tiananmen Square at dangerous levels of air pollution on January 23, 2013 in Beijing, China. The air quality in Beijing on Wednesday hit serious levels again, as smog blanketed the city. (Photo by Feng Li/Getty Images)

BEIJING, CHINA – Tiananmen Square, January 23, 2013 (Photo by Feng Li/Getty Images)

Forbes, here, and reports that China is building a  200 MW solar farm in the Gobi Desert (Clean Technica, here, IFL Science, here.

However, Chinese authorities plan for carbon emissions to peak in 2030 – that is to keep increasing until 2030.  Bellona, here, reported that Chinese authorities plan to increase renewables to 20% by 2030. This will include 200 GW of Wind, 100 GW of Solar. The plan is also to increase burning of Natural Gas to 10% of their electricity capacity, and to focus on coal with carbon capture. (Apparently the Chinese authorities don’t seem to realize how much carbon sequestration really costs. It is, as they say in New England, “wicked expensive.”)

Continue reading

Energy Portfolios, 3 Years, 1 Month: Sustainable Energy Up 135.6, Fossil Fuel DOWN 42.8%

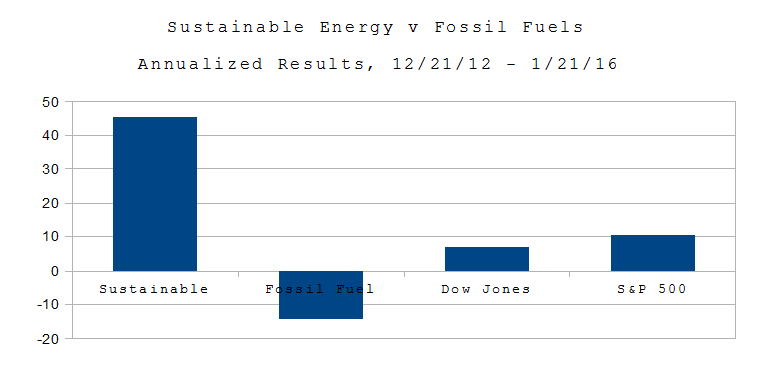
PLPort.1601Wall St. 1/21/16. On Dec. 21, 2012, I put $16 Million imaginary dollars in equal imaginary investments in 16 real energy companies; $8.0 in the Sustainable Energy space and $8.0 in the fossil fuel space.
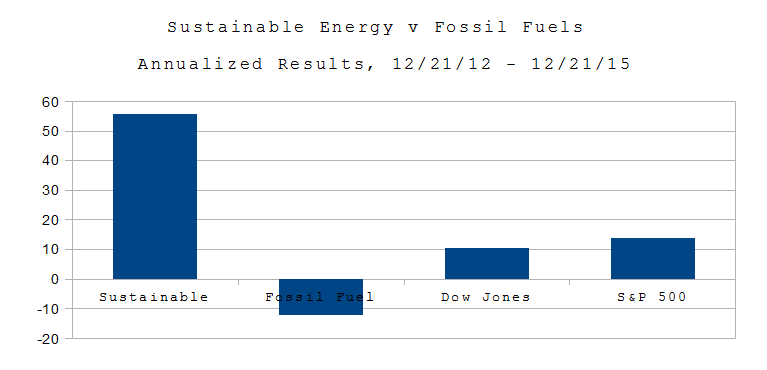
Today it is worth an imaginary $23.48 Million because while the Fossil Fuel portfolio dropped 42.8% of it’s total value, the Sustainable Energy portfolio increased 135.6%.

This excludes the value of dividends and transaction costs, but includes the bankruptcy or crash of three companies in the sustainable energy space.

This month’s post was delayed due to preparations for and digging out from Blizzard Jonas.

Continue reading

Energy Portfolios, 3 Years: Sustainable Energy Up 166.6%, Fossil Fuel DOWN 36.23%

PLPort.1512On Dec. 21, 2012, I put $16 Million imaginary dollars in equal imaginary investments in 16 real energy companies; $8.0 in the Sustainable Energy space and $8.0 in the fossil fuel space. Excluding the value of dividends and transaction costs, but including the bankruptcy or crash of three companies in the sustainable energy space.

As of the close of trading on December 21, 2015:

  • The Fossil Fuel portfolio was worth $5.1 Million, down 36.23% overall, down 12.08% on an annualized basis.
  • The Sustainable Energy portfolio was worth $21.33 Million, up 166.6%, overall and 55.53% on an annualized basis.
  • The Dow Jones Industrial Average is up 31.8% overall and 10.6% on an annualized basis, from 13,091 on 12/21/12 to close at 17,252 on 10/21/15.
  • The S&P 500 is up 41.33% overall and 13.78% on an annualized basis, from 1,430 on 12/21/12 to close at 2,021 on 10/21/15.
  • If there’s a war on coal, it’s part of the war on fossil fuel – and fossil fuel is losing.

Continue reading

COP 21 – the Future Began Yesterday

globe_west_540

Earth, The Blue Marble, courtesy NASA

COP 21 is, perhaps, the most important international effort in history. It concluded with an agreement by 196 nations to limit CO2 emissions to hold global temperature rise to 1.5 degrees Centigrade or 3.3 degrees Fahrenheit (NPR).

The only way to do this is to phase out fossil fuels, quickly, and replace them with efficient use of sustainable energy systems, i.e., solar, wind, geothermal, hydro, and insulation.

Continue reading