Category Archives: Energy

Energy Portfolios, 2 Years 10 Months: Sustainable Energy Up 125%, Fossil Fuel DOWN 27%

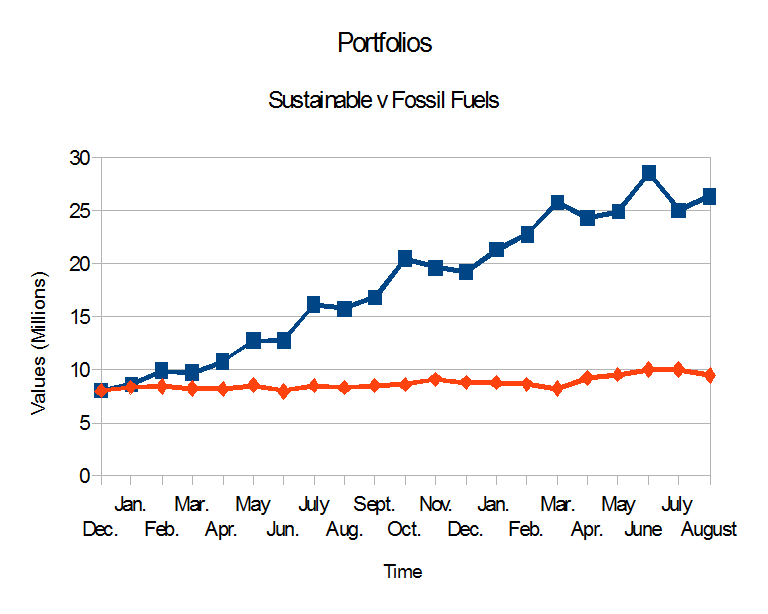
PLPort.1510On Dec. 21, 2012, I put $16 Million imaginary dollars in equal imaginary investments in 16 real energy companies; $8.0 in the Sustainable Energy space and $8.0 in the fossil fuel space. Excluding the value of dividends and transaction costs, but including the bankruptcy or crash of three companies in the sustainable energy space.

As of the close of trading on October 21, 2015:

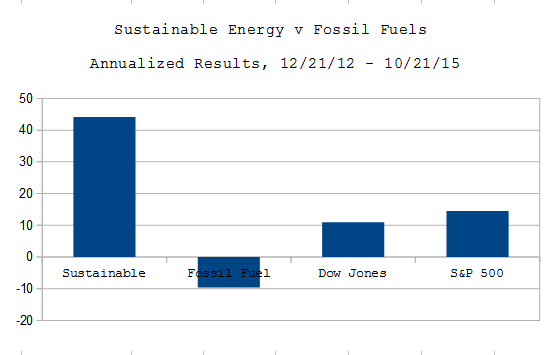
  • The Fossil Fuel portfolio was worth $5.82 Million, down 27.3% overall, down 9.64% on an annualized basis.
  • The Sustainable Energy portfolio was worth $18.0 Million, up 125.0%, overall and 44.13% on an annualized basis.
  • The Dow Jones Industrial Average is up 31.15% overall and 10.99% on an annualized basis, from 13,091 on 12/21/12 to close at 17,169 on 10/21/15.
  • The S&P 500 is up 41.19% overall and 14.54% on an annualized basis, from 1,430 on 12/21/12 to close at 2,019 on 10/21/15.

Continue reading

Energy Portfolios, 2 years 8 months Sustainable Energy Up 103%, Fossil Fuel DOWN 34%

PLPort.1508On Dec. 21, 2012, I put $16 Million imaginary dollars in equal imaginary investments in 16 real energy companies; $8.0 Million in the Sustainable Energy space and $8.0 Million in the fossil fuel space. Excluding the value of dividends and transaction costs, but including the bankruptcy or crash of three companies in the sustainable energy space,

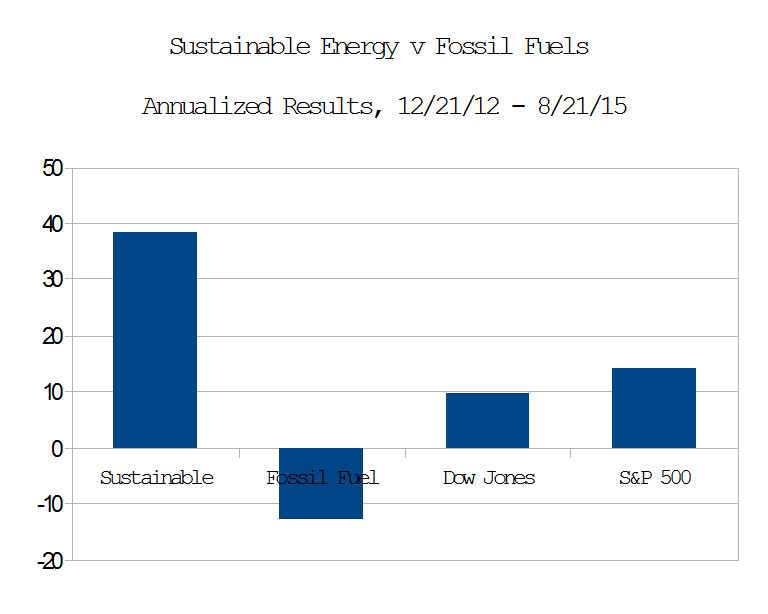
  • The Fossil Fuel portfolio is now worth $5.26 Million, down 34.28% overall, 12.85% on an annualized basis.
  • The Sustainable Energy portfolio is now worth $16.2 Million, up 102.6%, 38.48% on an annualized basis.
  • The Dow Jones Industrial Average is up 25.74%, 9.65% on an annualized basis, from 13,091 on 12/21/12 to close at 16,460 on 8/21/15.
  • The S&P 500 is up 37.8%, from 1,430 to close at 1,971 on 8/21/15.
  • The Fossil Fuel and Sustainable Energy portfolios, like the indices, are down in the last month.

The conclusion, that investors are moving away from Fossil Fuels and into Sustainable Energy, seems logical, if not obvious.

Continue reading

On New Jersey’s Energy Master Plan

On August 17, 2015, I attended the Board of Public Utilities, BPU, hearings regarding New Jersey’s Energy Master Plan, EMP.

The beach and cyclone at Seaside Heights, NJ, before and after Hurricane Sandy, Oct. 2014

The beach and cyclone at Seaside Heights, NJ, before and after Hurricane Sandy, Oct. 2014

A lot of people, myself included, spoke about Sandy. (Photos, click here).

Many spoke of the need for the BPU to act independently of the Governor and think long term.

No one spoke about a need or want for more fossil fuels or more nuclear.

The lobbyist from the NJ GCA, The Gasoline, C-Store, Automotive Association told the commissioners how happy he was that he installed a solar energy system on his home and said that gas stations need robust electricity. They can’t simply install emergency generators that burn diesel or gasoline.

Image of the Lillgrund, Sweden wind farm, courtesy of Siemens

Lillgrund, Sweden, courtesy Siemens

I called for: 140% clean, renewable, sustainable electricity by 2030:

  • Solar: 3.5 GW
  • Wind: 3.5 GW
  • Batteries: 1.5 GW
  • Biofuel: 1.5 GW

Including:

  • 250 MW of solar in a 100 KW array on each of the 2500 public schools,
  • 125 MW of battery backups, in a 50 KW Tesla Powerwall or equivalent system on each public school,
  • These would give us emergency shelters, with power, in every community in New Jersey.
  • A Capstone microturbine, or the equivalent at each sewage treatment plant.

These, I explained, would make the grid more resilient.

I also added that Wall Street appears to be abandoning fossil fuels. This observation is based on the data collected from Dec. 12, 2012, and published on Popular Logistics, here, that show that for the period from Dec. 21, 2012 to July 21, 2015,

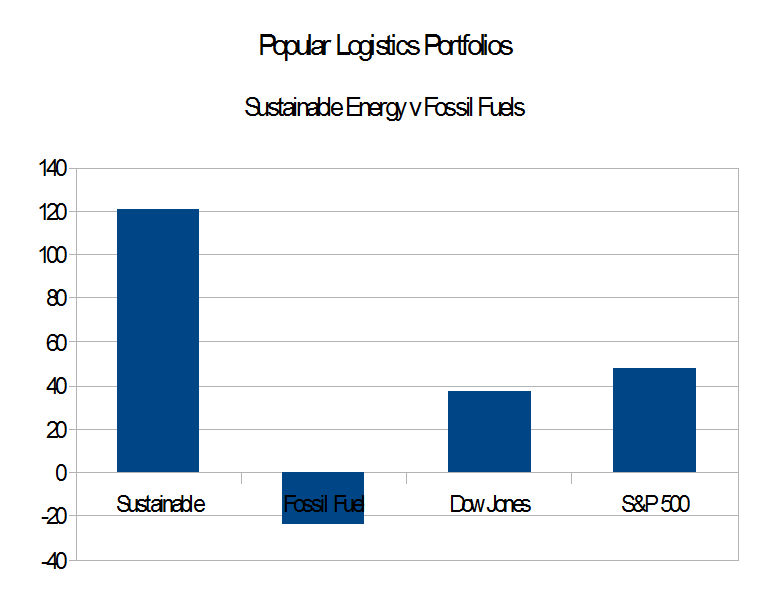
  • Sustainable Energy: Up 121%, 46.7% per year.
  • Fossil Fuel: DOWN 25% overall, -9.26% per year,
  • S&P 500: Up 47.54%, 18.41% per year.

The full text of my prepared remarks is below:

Continue reading

Energy Portfolios, 2 years 7 months Sustainable Energy Up 121%, Fossil Fuel DOWN 24%

PLPort.1507On Dec. 21, 2012, I put $16 Million imaginary dollars in equal imaginary investments in 16 real energy companies; $8.0 in the Sustainable Energy space and $8.0 in the fossil fuel space. Excluding the value of dividends and transaction costs, but including the bankruptcy or crash of three companies in the sustainable energy space.
  • The Fossil Fuel portfolio is now worth $6.09 Million, down 23.93%.
  • The Sustainable Energy portfolio is now worth $17.64 Million, up 120.54%.
  • Both Fossil Fuel and Sustainable Energy are down slightly in the last month.
  • The Dow Jones Industrial Average is up 37.6%, from 13,091 on 12/21/12 to close at 18,016 on 7/21/15.
  • The S&P 500 is up 47.6%, from 1,430 to close at 2,110 on 7/21/15.

Continue reading

Deepwater Horizon may cost BP $53.8 Billion – 43.1% of it’s current value

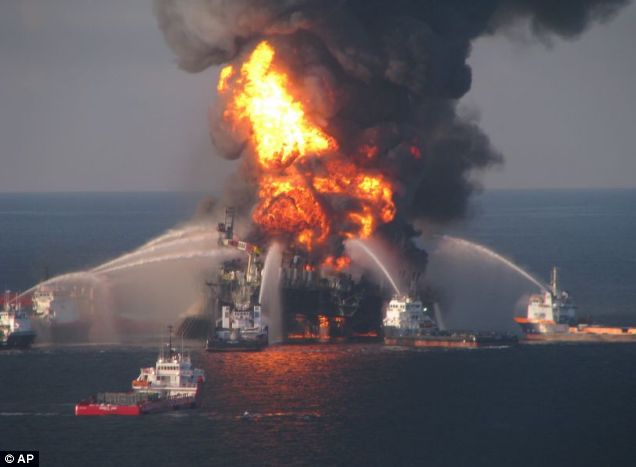
Image of the fire from the oil spill

Deepwater Horizon Spill in 2010. Photo: Gerald Herbert, AP.

11 Crew were lost in the explosion and fire on the Deepwater Horizon rig on April 20, 2010. In addition, roughly 5.2 million barrels of oil poured into the Gulf of Mexico during the 87 days between April 20, 2010 when the explosion occurred and July 15, 2010 when the well was capped.

BP, found guilty of “Gross Negligence” and “Willful Misconduct” in the Deepwater Horizon oil spill, (BBC, EcoWatch), has agreed to pay $18.7 Billion over the next 15 years (BP Press Release, Reuters) to settle various claims with the United States, the states of Florida, Alabama, Mississippi, Louisiana and Texas, and others.  This amounts to 14.8% of BP’s current market capitalization.

Pursuant to the agreements, BP will pay $1.1 Billion per year over the next 15 years. While the $18.7 Billion amounts to 14.8% of BP’s current market capitalization of $125.59 Billion, the $1.1 Billion per year is only a loss of 0.88% of BP’s current market capitalization each year.

However,

Continue reading

Energy Portfolios, 2 Years 3 Months: Sustainable Energy: UP 128%, Fossil Fuels: DOWN 16%

PLPort.2015.3.21

On Dec. 21, 2012, I put $16 Million imaginary dollars in equal imaginary investments in 16 real energy companies; $8.0 in the Sustainable Energy space and $8.0 in the Fossil Fuel space. The pattern, clear by March, 2013, is the Sustainable Energy Space is outperforming and the Fossil Fuel space is underperforming the indices.

Excluding the value of dividends and transaction costs,

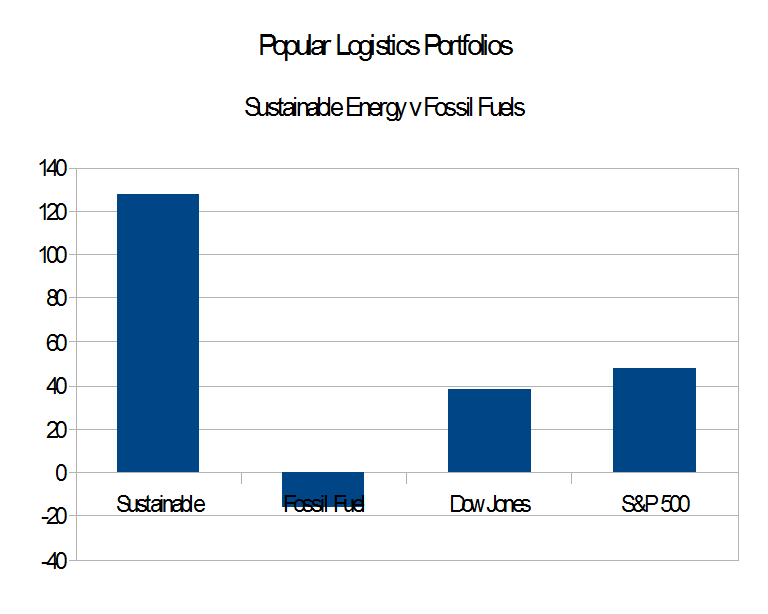
  • The Fossil Fuel portfolio is now worth $6.7 Million, down 16.07%.
  • The Sustainable Energy portfolio is now worth $18.2 Million, up 127.62%.
  • The Dow Jones Industrial Average is up 38.47%, from 13,091 on 12/21/12 to 18,209 on 3/20/15
  • The S&P 500 is up 47.42%, from 1,430 to 2,108.

Continue reading

Energy Portfolios: 22 Months: Sustainable Energy Up But Dropping

PLPort.2014.10.21

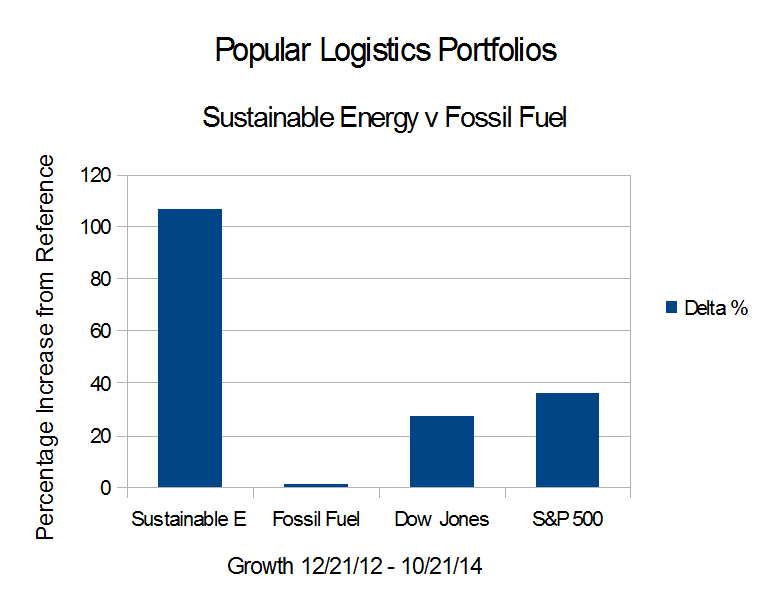
On Dec. 21, 2012, I put $16 Million imaginary dollars in equal imaginary investments in 16 real energy companies; Eight in the Sustainable Energy space and eight in the fossil fuel space. Between December 21, 2012 and October 21, 2014

By 10/15/14, GT Advanced Tech had filed for bankruptcy protection, and other stocks in the portfolio dropped to points near their Dec. 2012. The portfolio as a whole dropped 55% from Sept. 19, 2014. Stay tuned, and keep your seat belt on. Continue reading

Ft. Calhoun Plant – Reopened After 2 Years, 8 Months and Over $970 Million

Fort Calhoun plant, seen from above.

Ft Calhoun Plant – Arial View

The Fort Calhoun nuclear plant reopened in December, 2013. The plant, on the west bank of the Missouri River about 20 miles north of Omaha, Nebraska, closed for refueling in April, 2011, and was flooded in June, 2011. Refueling a nuclear plant typically takes about 6 – 12 weeks. Due to the flooding, the Fort Calhoun plant was closed for 970 days, from April, 2011 until December, 2013. (NY Times / Associated Press, here). Back in June, 2011, the cost estimate by David Lochbaum, Union of Concerned Scientists, was roughly $970 Million in lost revenue, plus the costs of repairs. Continue reading

Energy Portfolios – Simple Analysis re the Fossil Fuel Portfolio

The Deepwater Horizon Spill

The Deepwater Horizon Spill

“You can’t have oil without oil spills.” – Markwayne Mullin, R, Oklahoma. (Official / GovTrack)

Wind and Sun Won’t Spill

In a period when the Dow Industrials rose 30%, the S&P 500 rose 40%, and the Popular Logistics “Sustainable Energy Portfolio” rose 223%, the “Fossil Fuel Portfolio” rose 21%.

This suggests that a paradigm shift is underway in the energy industry.

Continue reading

Energy Portfolios: 20 Months: Conclusions & Observations

PL_Port_1408Conclusions:

  1. The performance of most of the companies in these portfolios supports the hypothesis that a paradigm shift away from fossil fuels and toward renewable energy systems is underway.
  2. Investing in an index fund may have been more lucrative – and less stressful – than investing in the Fossil Fuel portfolio.
  3. Investing in paradigm shifting technology, i.e., First Solar, Sunpower, GT Advanced Technology and Vestas may be very lucrative.
  4. A diversified portfolio in paradigm shifting technology may also be effective. The “home runs” will more than make up for the “strike-outs.”
  5. Investing in a well-run, or well-connected, company, i.e., Haliburton, in a declining industry may also be lucrative.

Observations:

  1. The long term trend appears to be that investments in Sustainable Energy are likely to pay off in the long term and also, probably, the short term.
  2. Investments in Fossil Fuels, however do not appear likely to appreciate in the near future, even in a “Bull Market,” such as we appear to be in.  However, a speculator, i.e., a gambler, may be able to play various fossil fuel stocks, buying at lows and selling at highs. While I am not an investment professional, I personally, don’t know if this is worth the risk. I prefer to do my gambling in Atlantic City, New Jersey and Las Vegas, Nevada.
  3. When considered against the backdrop of global geopolitics, i.e., Russia, which exports oil and methane, invading Ukraine, ISIS in Iraq and Syria threatening to take over Iraqi oil operations, other turmoil in the Middle East, a paradigm shift away from fossil fuels seems likely to insulate energy flows from remote geopolitical events and strengthen economies that have executed this paradigm shift. Therefore, investments supporting such a paradigm shift may do well, while investments supporting the existing paradigm may not.

Continue reading

Energy Portfolios: 19 Months: Sustainable up 222%, Fossil Fuel up 25%

PLPortfolio.1407aOn Dec. 21, 2012, I put $16 Million imaginary dollars in equal imaginary investments in 16 real energy companies; Eight in the Sustainable Energy space and eight in the fossil fuel space. Here are the results since Dec. 21, 2012:

  • The Dow Jones Industrial Average is up 30.26%.
  • The S&P 500 is up 38.04%.
  • The Fossil Fuel Portfolio is continues to dramatically underperform the reference indices. It is up 25.08% from Dec. 21, 2012.
  • The Sustainable Energy portfolio is down 11% from last month, but is up 221.77% from Dec. 21, 2012.

The details are below.

Continue reading

Energy Portfolios, 18 Months, Analysis

EnergyPortfolios_Indices_2014_06 We are watching a paradigm shift.

How else can we explain the dramatic rise of the Sustainable Energy portfolio, the equally dramatic underperformance of the Fossil Fuel portfolio, compared to the Dow Industrials and the S&P 500 since I started this experiment on Dec. 21, 2012? The data are in my post of June 24, 2014, Energy Portfolios, 18 Months: Sustainable up 257%, Fossil Fuels up 24.6%.

Consider these questions:

  1. Which companies are Disruptive or Subject to Disruption?
  2. Which companies are Evolving and which are doing what worked for the last 20/30/50/80 years?
  3. Can management execute?
  4. Is management asking for government subsidies?
  5. What about the long term side effects? What are the Economic Externalities?

Continue reading

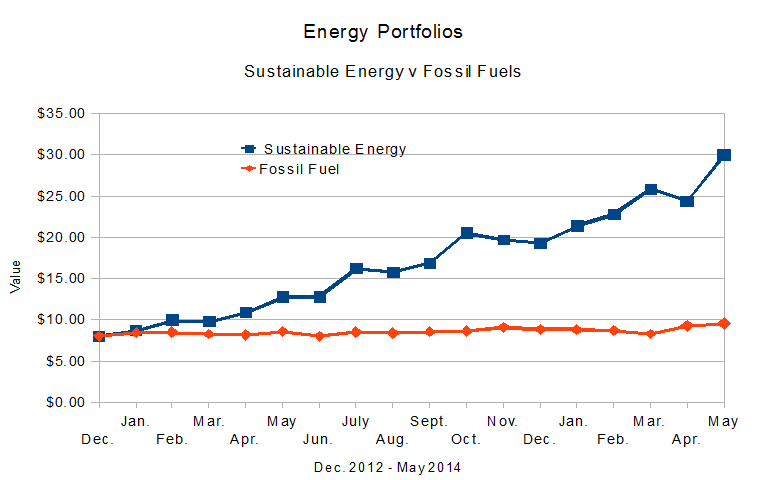
Energy Portfolios: 18 Months: Sustainable up 257.06%: Fossil Fuel up 24.56%

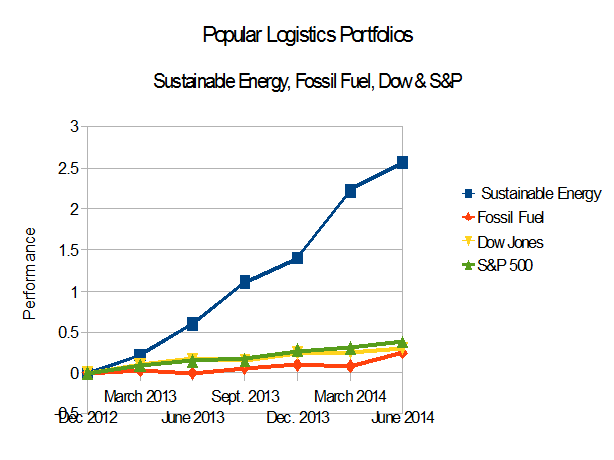
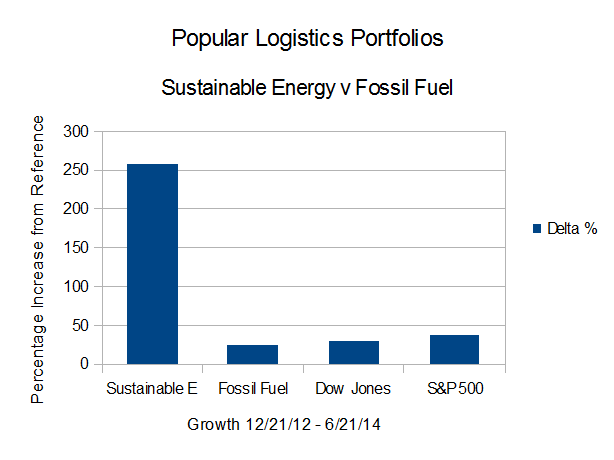
PL_EnergyPort_14_06On Dec. 21, 2012, I put $16 Million imaginary dollars in equal imaginary investments in 16 real energy companies; Eight in the Sustainable Energy space and eight in the fossil fuel space. In the 18 months between the close of trading December 21, 2012 and the close of trading June 20, 2014,

  • The Dow Jones Industrial Average is up 29.46% from 12/21/12.
  • The S&P 500 is up 37.27%.
  • The Fossil Fuel Portfolio is up 24.56% from Dec. 21, 2012.
  • The Sustainable Energy portfolio is up 257.06% from Dec. 21, 2012.

In addition to the data summary, below, this post, the 21st in the series, will be followed with a summary analysis.

Continue reading

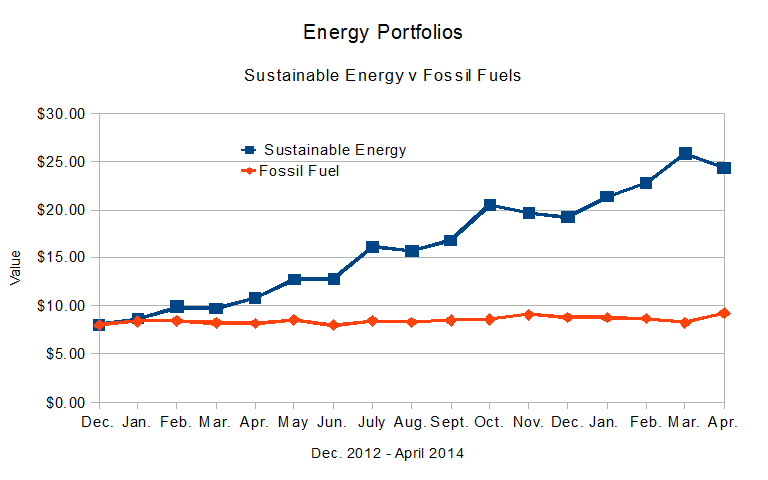
Energy Portfolios: 17 Months: Sustainable up 211.6%: Fossil Fuel up 18.52%

EnergyPortfolios_1405aThe Dow Jones Industrial Average is up 26.29% from 12/21/12.
The S&P 500 is up 32.03%.
The Fossil Fuel Portfolio is up 18.52% from Dec. 21, 2012.
The Sustainable Energy Portfolio is up 211.6% from Dec. 21, 2012. Continue reading

Energy Portfolios, 16 Months: Sustainable Energy up 204.25%, Fossil Fuel up 15.38%

PL_Port.14.4aOn Dec. 21, 2012, I put $16 Million imaginary dollars in equal imaginary investments in 16 real energy companies; Eight in the Sustainable Energy space and eight in the fossil fuel space. The results:

  • The Dow Jones Industrial Average is up 24.54% from Dec. 21, 2012.
  • The S&P 500 is up 30.56% from Dec. 21, 2012.
  • The Fossil Fuel Portfolio had a great month, however, it continues to dramatically underperform the reference indices. It is up 15.38% from Dec. 21, 2012.
  • The Sustainable Energy portfolio had a bad month, however, it continues to dramatically outperform the averages, and is up 204.25% from Dec. 21, 2012


Continue reading