Category Archives: Sustainable

Energy Portfolios: 20 Months: Conclusions & Observations

PL_Port_1408Conclusions:

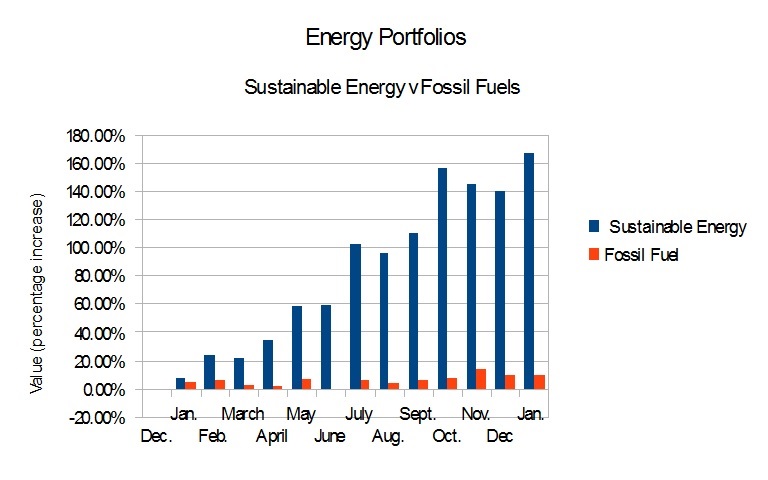
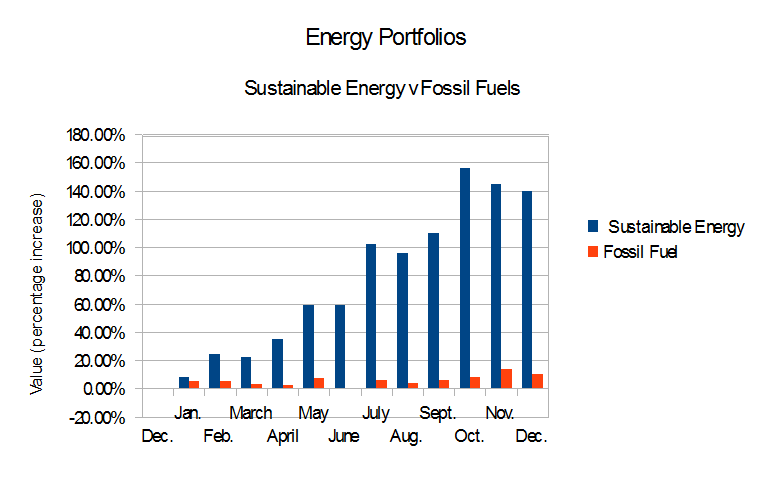
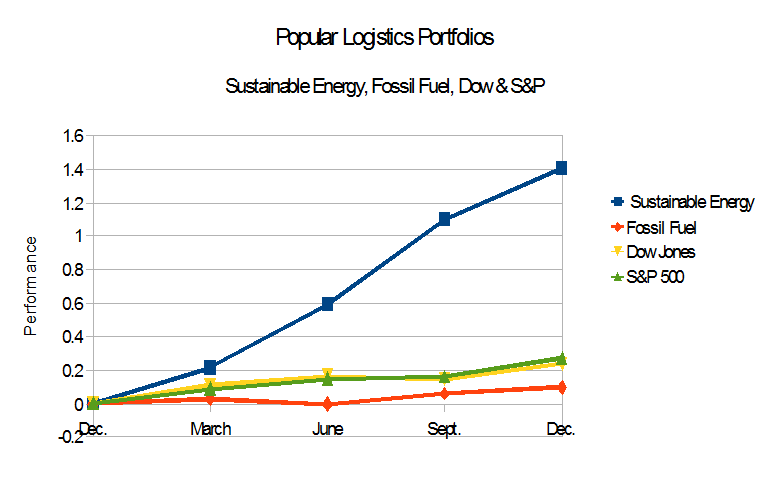
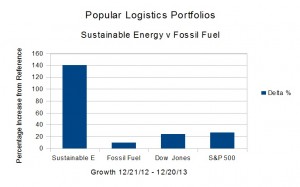
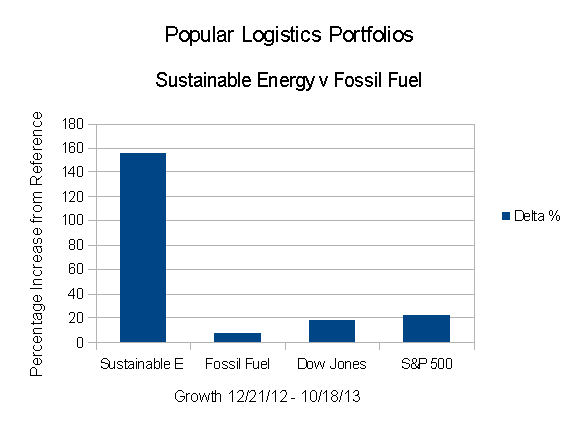
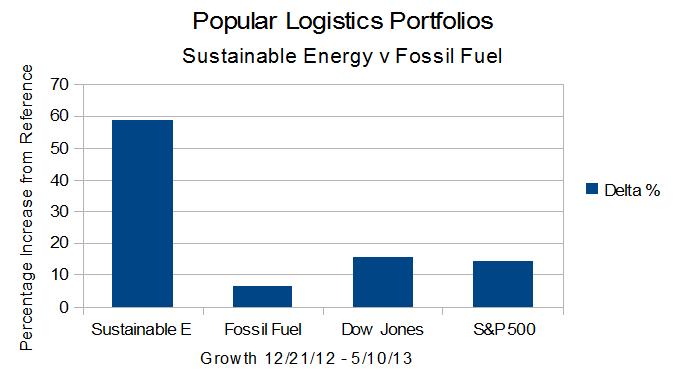
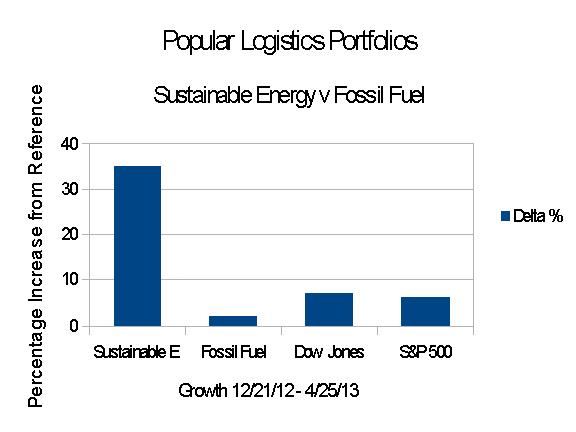
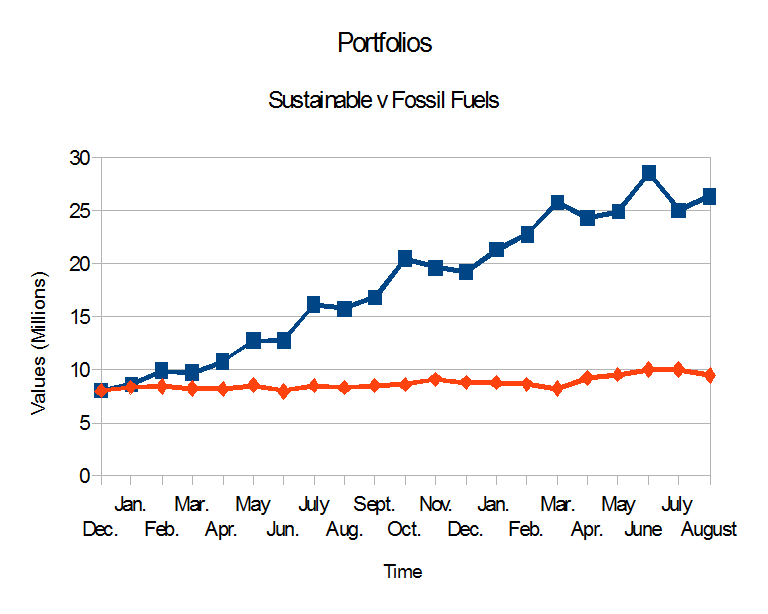
  1. The performance of most of the companies in these portfolios supports the hypothesis that a paradigm shift away from fossil fuels and toward renewable energy systems is underway.
  2. Investing in an index fund may have been more lucrative – and less stressful – than investing in the Fossil Fuel portfolio.
  3. Investing in paradigm shifting technology, i.e., First Solar, Sunpower, GT Advanced Technology and Vestas may be very lucrative.
  4. A diversified portfolio in paradigm shifting technology may also be effective. The “home runs” will more than make up for the “strike-outs.”
  5. Investing in a well-run, or well-connected, company, i.e., Haliburton, in a declining industry may also be lucrative.

Observations:

  1. The long term trend appears to be that investments in Sustainable Energy are likely to pay off in the long term and also, probably, the short term.
  2. Investments in Fossil Fuels, however do not appear likely to appreciate in the near future, even in a “Bull Market,” such as we appear to be in.  However, a speculator, i.e., a gambler, may be able to play various fossil fuel stocks, buying at lows and selling at highs. While I am not an investment professional, I personally, don’t know if this is worth the risk. I prefer to do my gambling in Atlantic City, New Jersey and Las Vegas, Nevada.
  3. When considered against the backdrop of global geopolitics, i.e., Russia, which exports oil and methane, invading Ukraine, ISIS in Iraq and Syria threatening to take over Iraqi oil operations, other turmoil in the Middle East, a paradigm shift away from fossil fuels seems likely to insulate energy flows from remote geopolitical events and strengthen economies that have executed this paradigm shift. Therefore, investments supporting such a paradigm shift may do well, while investments supporting the existing paradigm may not.

Continue reading

Energy Portfolios: 19 Months: Sustainable up 222%, Fossil Fuel up 25%

PLPortfolio.1407aOn Dec. 21, 2012, I put $16 Million imaginary dollars in equal imaginary investments in 16 real energy companies; Eight in the Sustainable Energy space and eight in the fossil fuel space. Here are the results since Dec. 21, 2012:

  • The Dow Jones Industrial Average is up 30.26%.
  • The S&P 500 is up 38.04%.
  • The Fossil Fuel Portfolio is continues to dramatically underperform the reference indices. It is up 25.08% from Dec. 21, 2012.
  • The Sustainable Energy portfolio is down 11% from last month, but is up 221.77% from Dec. 21, 2012.

The details are below.

Continue reading

Energy Portfolios: 13 Months: Sustainable up 167.4%: Fossil Fuel up 8.92%

PL_Portfolio_14_1Figure 1, above, shows the relative performance of my hypothetical investments in sustainable Energy and Fossil Fuels, since Dec. 21., 2012.

  • The Dow Jones Industrial Average is up25.38% from 12/21/12.
  • The S&P 500 is up28.95%.
  • The Fossil Fuel Portfolio continues to dramatically underperform the reference indices. It is up 9.44% from Dec. 21, 2012, and down slightly from Dec. 20, 2013.
  • The Sustainable Energy portfolio continues to dramatically outperform the fossil fuel portfolio and the averages, and is up 167.37% from Dec. 21, 2012.

As described in the earlier posts in this series, in Dec., 2012, I read that MidAmerican Energy was buying large scale solar electric generating stations being built by First Solar and Sunpower, and being financed by GE. This got me thinking … Continue reading

Energy Portfolios & Reference Indices, 2013 Summary

If a picture is worth a thousand words …

EnergyPortfolios_2013

here are two thousand words on Sustainable Investing in 2013.

EnergyPortfolios_Indices

While the data may suggest that a “correction” may be in progress for the “Sustainable Energy” portfolio, and while the actions or inactions of various governments can dramatically effect performance of these portfolios, the Sustainable Energy Portfolio outperformed the Dow Jones Industrials and the S&P 500, both of which outperformed the Fossil Fuel Portfolio.

As the professional say, “Past performance is no guarantee of future performance.”

Continue reading

Energy Portfolios At One Year: Sustainable Energy up 140%, Fossil Fuel up 9.85%

PL_EnergyPort_13_12

On Dec. 21, 2011, reading that MidAmerican Energy was investing in utility scale solar energy generation, I looked at First Solar and Sunpower. Then I looked at six other companies in the sustainable energy world. I created a model portfolio. To make things interesting, I looked at eight companies in the fossil fuel industy and invested $16 Imaginary Million in these 16 companies, $1.0 Imaginary Million in each. As of the close of trading one year later, Friday, Dec. 20, 2013,

  • The Dow Jones Industrial Average is up 23.91% from 12/21/12.
  • The S&P 500 is up 27.13%.
  • The Fossil Fuel Portfolio continues to dramatically underperform the reference indices. It is up 9.85% from Dec. 21, 2012.
  • The Sustainable Energy portfolio continues to dramatically outperform the averages, and is up 140.31% from Dec. 21, 2012.

The data are summarized beginning in Table 1, below.

Continue reading

In RE Carbon Dioxide – The EPA is Listening

Hurricane Sandy, NOAA handout satellite image taken on October 27, 2012.

Hurricane Sandy, via satellite, 10/27/12, NOAA

The people at the Environmental Protection Agency understand the issue of increasing atmospheric Carbon Dioxide above 350 PPM. And EPA is listening. EPA has held two public comment periods in New York City on 10/23/13 and will hold nine additional public comment hearings across the country to “solicit ideas and input from the public and stakeholders about the best Clean Air Act approaches to reducing carbon pollution from existing power plants.”

Boston, MA 11/04/13 Philadelphia, PA 11/08/13
Chicago, IL 11/08/13 San Francisco, CA 11/05/13
Dallas, TX 11/07/13 Seattle, WA 11/07/13
Denver, CO 10/30/13 Washington, DC 11/07/13
Lenexa, KS 11/04/13


Click HERE to register.

And as President Theodore Roosevelt said, “Speak softly …”

Continue reading

Sustainable Investing: Green Energy, Green Economy

PLEP_13.10.18

On Dec. 21, 2012, with $16 Imaginary Million, I created an investment simulation. I invested $1.0 Million in imaginary money in each of eight fossil fuel companies and eight sustainable energy companies. As of the close of trading 10 months later, Friday, Oct. 18, 2013, the trend, clearly evident after three months, in March of this year, continues.

  • The Dow Jones Industrial Average is up 17.64% from 12/21/12.
  • The S&P 500 is up 22.03%.
  • The Fossil Fuel Portfolio, dramatically underperforming the reference indices, is up 7.47%.
  • The Popular Logistics Sustainable Energy portfolio is up 156.14%.

As discussed last month, in “Investing for the Future,” the important question is:  Is this a trend or a bubble?  As I wrote, I think it’s a trend.

Jeremy Grantham, the “G” in GMO, invests with the expectation that all things being equal, a company’s valuation tends toward their arithmetic mean values. (Note that Mr. Grantham has not been contacted for this study.) But note that disruptive technologies are, by definition, game changers. Disruptive tech alters the landscape. If you looked at the airline, automobile and railroad industries over the 20th Century, automobiles and airlines waxed while railroads waned.

The future may be similar for Fossil Fuels and Sustainable Energy. The Market Capitalization of the Fossil Fuel portfolio is $1.13 Trillion. The Market Capitalization of the Sustainable Energy Portfolio is $0.06 Trillion ($60 Billion).  The value of the companies of the Sustainable Energy portfolio is roughly 5.3% of the market capitalization of the companies of the Fossil Fuel portfolio. It can almost be described as a rounding error compared to the value of the Fossil Fuel portfolio. But if Mr. Grantham’s analysis is valid, and you aggregate the portfolios into one called “Energy” as opposed to a “Fossil Fuel” portfolio and a “Sustainable Energy” portfolio, then the shareholders of these various companies are in for an interesting few years.

Continue reading

Popular Logistics Energy Portfolios: The Trend Continues.


Popular Logistics Energy Portfolios

The trend is clear – if 4 1/2 months is enough to establish a trend – the Sustainable Energy portfolio is up 58.78% from 12/21/12 while the Fossil Fuel portfolio is only up 6.71%. The Dow is up 15.49% and the S&P 500 is up 14.24% in that same period.

Is it because Atmospheric Carbon Dioxide has reached 400 PPM? (NPR / NY Times) Is Wall Street reacting because Goldman Sachs and JP Morgan, and other investment banks and hedge funds are hiring analysts from Greenpeace or people like me with MBAs in Sustainability from Marlboro, the Presidio, and the Bainbridge Institute? Continue reading

Solar Impulse solar-powered airplane: final test flight

Image via EvWorld.Com:

via EVWorld.com solarimpulse_goldengate480x320

This ultralight and ultrasilent solar and battery powered plane flew over  San Francisco, 4/24/13. It previously flew for 26 hours straight, taking off from it’s home base in Payerne, Switzerland, Wednesday, July 7, 2010 at 7:00 AM and landing Thursday, July 8, 2010 at 9:06 AM.
Continue reading

Earth Day, 2013. Oil Spills, Explosions, Fracking Business As Usual & The Stock Market Response

PLPort_Results.2013.04

Wall St. NYC, April 26, 2013. Monday, April 22, 2013 was Earth Day.  At the close of trading Thursday, April 25, 2013,  as compared to my reference date of Dec. 21, 2012, the Dow Jones Industrials was up 12.3% , the S&P 500 closed up 10.84%, the “Popular Logistics Fossil Fuel Reference Portfolio was up 1.8% and the Popular Logistics Sustainable Energy portfolio was up 34.85%. (This is in line with the trend noted in my previous post, March 23, 2013., in the series that began Dec. 21, 2012.) And Shell Oil has temporarily suspended exploration and drilling operations in the Arctic. (Click here for Forbes). The stock portfolio data are summarized below, in Table 1. That’s the good news (unless you’re long on fossil fuels).

Here’s the bad news. “Fracking” is widespread and unregulated (click here).  An oil spill dumped 500,000 gallons from Exxon pipeline onto Mayflower, Arkansas and into Lake Conway (click here).  A fatal fire & explosion in West, Texas left 35 dead, probably including 16 firefighters and emergency responders (click here).  A fire and multiple explosions on gasoline transport barges docked in Mobile, Alabama injured 3 (click here).  Continue reading

Mayflower Oil Spill – Economic Externalities

Image showing oil covering lake at Dawson's Cove, Mayflower, Arkansas

Image showing oil covering lake at Dawson’s Cove, Mayflower, Arkansas

Back in the mid-1970’s, Amory Lovins, currently with the Rocky Mountain Institute, said “The cheapest unit of energy is the one you don’t need to buy.” He called this the “Nega-Watt.” We now know that the Nega-Watt is also the cleanest unit of energy. And the second cheapest – and second cleanest – is the one which doesn’t need fuel and doesn’t create waste, which might be called the “Nega-Fuel-Watt” or “Nega-Waste-Watt.”

Edward McAllister, reported in Reuters, covered by Yahoo News,

Warren Andrews had just finished putting up balloons for his stepdaughter’s 18th birthday party at their suburban home in Mayflower, Arkansas, when his wife came inside and said something was wrong.

After stepping out of his house, and taking one glance, he immediately dialed 911.

“I don’t know what’s going on, but I’ve got a river of oil coming down the street at me,” Andrews told the operator.

Five minutes later, the slick of noxious black crude spewing from a ruptured Exxon Mobil pipeline was eight feet wide, six inches deep and growing fast.

We now know that an Exxon Mobil pipeline, like the proposed Keystone Pipeline, carrying Canadian crude oil ruptured on Friday, March 29, 2913, spilling an estimated 500,000 gallons of oil into the grounds of the town. 500,000 gallons is roughly 11,000 barrels.

Continue reading

What Next? – For the 21st Century

Barack-Obamajoe-biden

What should we do now?

  1. Strengthen the safety net.
  2. Reverse the Citizens United and Florence v Burlington rulings.
  3. Place reasonable restrictions on Second Amendment rights, as  reasonable restrictions exist on First Amendment rights. And tax properties and income of religious institutions.
  4. Address Climate Change.
  5. Develop a Renewable & Sustainable Energy Infrastructure – Clean & Green within 15.

As President Obama said, in his Second Inauguration, (White House . Gov / The Atlantic)

The commitments we make to each other …  do not sap our initiative; they strengthen us.  They do not make us a nation of takers; they free us to take the risks that make this country great.

“We will respond to the threat of climate change, knowing that the failure to do so would betray our children and future generations. 

“The path towards sustainable energy sources will be long and sometimes difficult.  But America cannot resist this transition, we must lead it.

Continue reading

Popular Logistics Sustainable Energy Portfolio

Earth from Space

Popular Logistics announces the Popular Logistics Sustainable Energy Portfolio Simulation.

This portfolio is composed of companies in the solar, biofuel and LED lighting industries.

I think these are disruptive technologies, like personal computers and workstations and client server software architecture in the 1980s and aircraft in the mid-20th and automobiles in the early 20th Century. We may be approaching, or may have recently crossed a “tipping point” in the Wind, Solar, LED lighting and Bio Fuel industries.

As points of reference, this “Sustainable Energy Portfolio” will be compared to an “UnSustainable Energy Portfolio,”  composed of oil industry stocks, and the Dow Jones Industrial Average and the S&P 500.

Continue reading

Solar Power & Electric Utilities: Is The Paradigm Shifting?

Ground Mounted Array.

The 16-module solar array pictured above was built in 2005.  It probably has 2.5 Kilowatt (KW) to 2.8 KW of nameplate capacity. In New Jersey, residential solar systems range from 3 KW to 30 KW. Most are between 4 and 10 KW. Commercial systems range from 8KW to 200 KW. Utility scale systems are in the 10 Mega Watt (MW) to 550 MW range. In 2005, the costs for small scale residential systems were around $8.50 / watt, exclusive of any incentives. Today it is probably around half that, and cheaper for the larger utility scale systems. 1.0 MW system would require 4,000 modules of 250 watts each. The system pictured above requires about 50 square feet of land.As illustrated by the photo of the Topaz array, below, a 550 MW system, like Topaz, would require 2.2 million modules, and would cover a lot of ground.

First Solar Topaz

First Solar, FSLR, a $2.8 Billion company, and Sunpower, SPWR, an $840 Million company, two of the pillars of what is left of the American solar energy industry, made some interesting statements in their 2011 annual reports: Continue reading

Buggy-Whips, Railroads & Oil: Systems Thinking on Fuel

West Texas PumpjackAt the 6th Annual Babson Energy Conference, “Energy, Environment, & Entrepreneurship: Challenging Assumptions, Changing Perceptions”, here, held March 30, 2012, Cimbria Badenhausen, (LinkedIn), an alum of the Marlboro College MBA in Managing for Sustainability, asked Tahmid Mizan, Senior Planning Advisor of Exxon Mobil, “Are you an ENERGY company or a PETROLEUM company?”

Mr. Mizan, of Exxon, didn’t answer the question.

Henry Ford, when asked why he doesn’t use focus groups, is believed to have said, “If I asked people what they wanted, they’d tell me faster horses.” (HBR) Continue reading