When stocks on the Shanghai Securities Exchange, the SSE, “corrected” on August 24, 2015, stocks in US and other markets followed. But nothing has fundamentally changed. None of the “Fundamentals” on any publicly traded U.S. or European companies have significantly changed (other than the Market Capitalization and Price Earnings ratios, which are, of course, functions of the stock price). Earnings per Share, EPS, the existence or lack thereof of what Warren Buffett calls a “moat,” debt to asset ratios, return on income, other financial ratios, were and remain unaffected by day to day fluctuations of stock price.

Charging Bull, by Arturo Di Monica
Stocks that were fundamentally bad investments on Friday, August 21, 2015 were likely to have been bad investments on Tuesday. August 25, 2015. Stocks that were good investments on Friday, August 21, 2015, were fundamentally somewhat better investments on Tuesday. August 25, 2015.

Dancing on the Charging Bull
The SSE Composite is not the S&P 500, or even the Dow. While there are frequent scandals involving insider trading and other financial improprieties, they are the exception and there are regulations designed to keep them that way. China, on the other hand …
The Shanghai Stock Exchange Composite index, the SSE Composite, looks kind of like the S&P 500. However, there are key differences between the indices.
Continue reading →
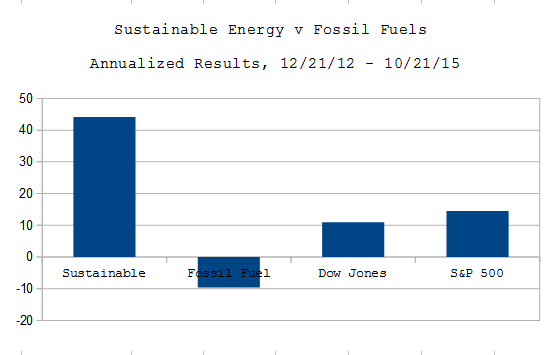
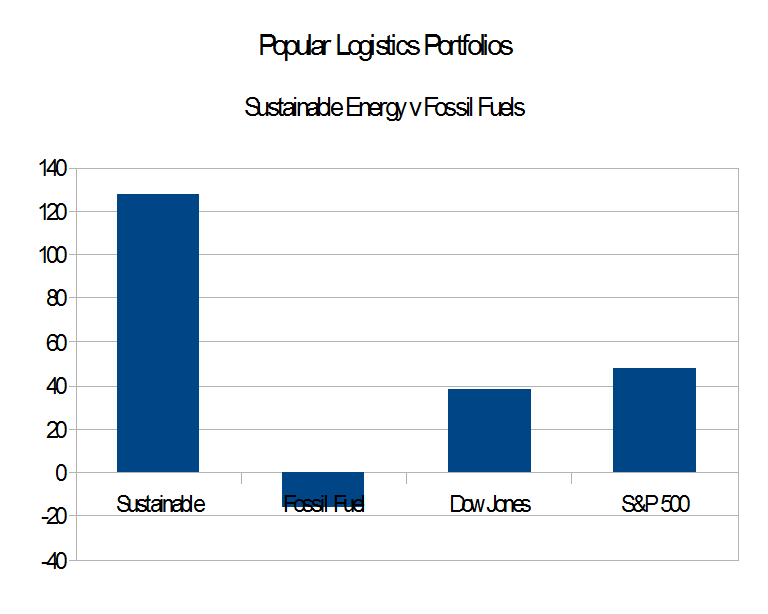
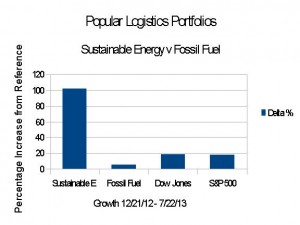
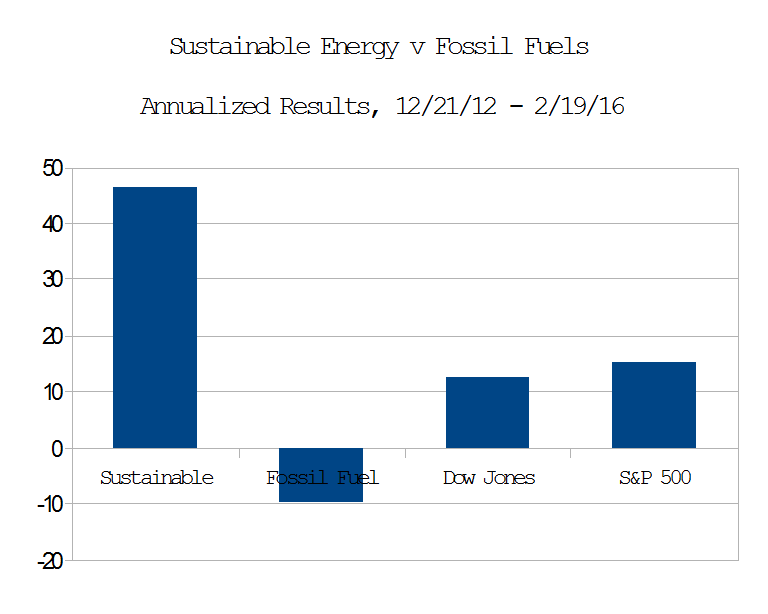 On Dec. 21, 2012, I put $16 Million imaginary dollars in equal imaginary investments in 16 real energy companies; $8.0 in the Sustainable Energy space and $8.0 in the fossil fuel space. Excluding the value of dividends and transaction costs, but including the bankruptcy or crash of three companies in the sustainable energy space, and one company in the fossil fuel space.