Category Archives: Information Design

DebateGraph.org: visualization and collaboration tools

Debategraph is a software tool with applications for addressing, defining and attacking many types of problems in many ways. Here’s one of their interactive maps on epidemiology:

Who’s using it? Apparently the White House, CNN, the Prime Minister and the Foreign Office in the United Kingdom. A concept map explaining DebateGraph itself appears below.

Continue reading

Images of London 7 July 2005 bombings

[imagebrowser id=100]

See also German authorities find new al-Qaeda documents hidden in porn files on flash drive: CNN (a related post here on Popular Logistics). The slideshow which follows is a preliminary attempt to compile a more useful visual data set of the events in London on 7 July 2005. We’ve got a few things in mind, after the jump:

Continue reading

Simple, clear navigation on Frederick County website

Frederick County, Maryland, uses a very simple red/green system on its website.  The only navigation buttons with a colored circle relate to emergency preparedness. In normal times – the button is green:

Non-emergency mode
(Non-emergency mode)

But, for emergency – including dangerous weather – notifications – the same button will be red and flashing. From the Frederick County website:

When this bar is on the homepage with a flashing red light, an emergency
condition exists. Clicking on this bar will lead to the Emergency/Weather Notices webpage, with information from emergency officials.

(Used during emergencies)

I assume that they’ve got a macro – or some other one-step process to substitute the red navigation button for the green.

It’s a nice touch – the feature – and the website – were designed by CivicPlus, a Kansas-based outfit that designs websites for governments and schools. Here’s a link to their portfolio.

Nathan Yau at Flowing Data – compendium of data visualization blogs

Nathan Yau, a doctoral candidate at UCLA in statistics, is the proprietor of Flowing Data, an excellent blog about data visualization. My guess is that it would be fair to say that there’s a greater emphasis on quantitative data viz, rather than instructional or other non-quantitative work. In any case – it’s excellent.

semaphore (Sierra - "S")Came across Yau’s April post – “Data Visualization Blogs You Might Not Know About” which, in and of itself, is an excellent list. Add to that the contributions of the commenters, including the always excellent Jorge Camoes.Camoes added  anoyhrt 15 listings; Tom Carden added over a dozen more; and a handful of people added one or two links. (As it happens, I’m trying to work out what for me is a visual representation of a complex argument – so I’m searching for a spot-on or really close analogy – hence my particular delight in finding such a collection). Take the post and comment together – and it’s much more than a starting point.

Here’s a link to Jorge Camoes’ charts blog; to Tom Carden’s blog (Random, etc.) – but if the subject is of interest, be sure to check out Nathan Yau’s work at Flowing Data.(this started as a somewhat longer post – but due to the vagaries of this particular WP 2.7 install – well, brevity is the soul of wit).

Reblog this post [with Zemanta]

Interview with signage expert Mies Hora

Just came across a remarkable interview of Mies Hora (“Navigating Today’sSigns – An Interview with Mies Hora”)(TinyUrl here ) by Stev Heller in the AIGA blog. Mies Hora is the founder of UltimateSymbol, which publishes books and usable electronic images of signs (as well as fonts and some other goodies). In a sense, these books make him the heir to Henry Dreyfuss

and Otto Neurath.

Infographics and more: Mike Dickison

Pictures of Numbers is one of the websites run by Mike Dickison, an accomplished polymath who’s done some excellent work in information design with scientific and other information. A typical post compares two ways of looking at religious attitudes in a set of countries; his point (if I understand correctly) is that one often has options of putting much richer data into a single information graphic. His solution – entirely workable – would never have occurred to me.

[Readers will notice an uptick in information graphics posts as we are trying to prepare a number of visual aids – initially a set which tries to explain our purpose here atPopular Logistics: to examine the intersection between the sets of policy problems generally named “disaster preparedness,” “public health,” “environmental policy,” “energy policy,” “transportation policy,” “urban planning,” and “terrorism.” They’ve all got common threads – and to a surprising extent, common solutions – and that’s what we’re here to explain. But we’d like to present a richer version of these arguments – with few words and many more graphics. Hence our return to the precincts of Edward Tufte – and his books, and other information designers. So – we apologize to any readers who regard these posts as “off-topic,” but promise that, in time, we’ll make clear these connections].

The post which nearly knocked me out of my chair was Graphical Octants – how to, readably, add a third axis to a standard X/Y axis – I’ve been wrestling with how to show three variables – for instance – for disaster preparedness interventions, wanting to demonstrate:

  • Cost of intervention (in dollars)
  • difficulty of implementation (does it require many people to make big changes in behavior, do something counterintuitive, take complicated or intimidating training, or require a big rearrangement of social status likely to engender resistance). One example – a thesis I’ll be expanding on in the near future – is that the American Cold War shelter program – even after President Kennedy’s promise to make fallout or blast shelters available to the entire population – probably foundered because of resistance to the civil rights movement: any public shelters built after Kennedy’s 1961 statement would have had to be, of necessity, either segregated or not segregated. Not to mention the mixing of the rich and poor in the same shelters. Hence – any government planner who wanted to address shelter construction had to consider local reactions to such issues.
  • Time needed to implement (e.g., blast shelters are best built during initial construction, and done that way, would take many years. Encouraging the distribution of AM radios, on the other hand, could be done with public education programs, using existing social mechanisms to distribute them (local governments, religious institutions), using the market (buying large numbers to subsidize economies of scale, exempting them from sales tax).

Dickison has an elegant graphic solution to this problem in Graphical Octants . We hope to update this post with illustrations after speaking with Mr. Dickison.
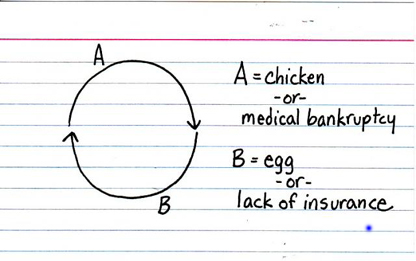
Accuracy Aesthetics – visual representation of NYS Power Grid

    I’ve been creating a series of diagrams – about  systems, risks, disaster planning scenarios – and also thinking about other ways to model risks, mitigation and response strategies – the ideal solutions of course would all involve open source software. Since the government is already paying primarily no attention to building community based preparedness programs, good data solutions are critical – but so is the lowest possible prices (which is to say: Open Sourceand free. While I haven’t found or developed what I think will be sufficient, the information design community (that may not be the right name) has in it a very large propertion of very smart people. (The best, and I own every one of his books, is Edward Tufte

    . Also his dog photos are the best.

    So I thought that, as I cast about for the proper data metaphors – I’d note some of the coolest – some of which are just beautiful, clever – and may or may not provide solutions for the planners in our audience. So – for the moment – the New York State power grid

    via Accuracy & Aesthetics: