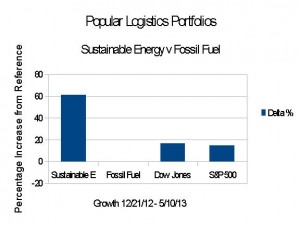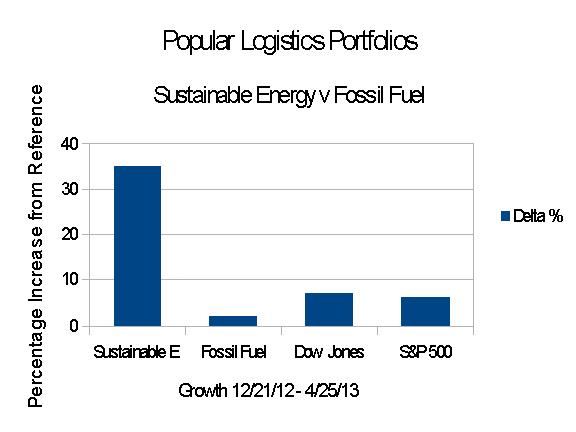
On Dec. 21, 2012, I put $16 Million imaginary dollars into 16 real energy companies; $8.0 in the Sustainable Energy space and $8.0 in the fossil fuel space, $1.0 Million into each. Excluding the value of dividends and transaction costs, but including the bankruptcy or crash of three companies in the sustainable energy space,
In recent months the Sustainable Energy portfolio has dropped and the Fossil Fuel portfolio has increased. However, this may prove to be a short term correction that has more to do with macro-geopolitical events emanating from Washington, DC than global macroeconomic factors.
As of the close of trading 59 months later,
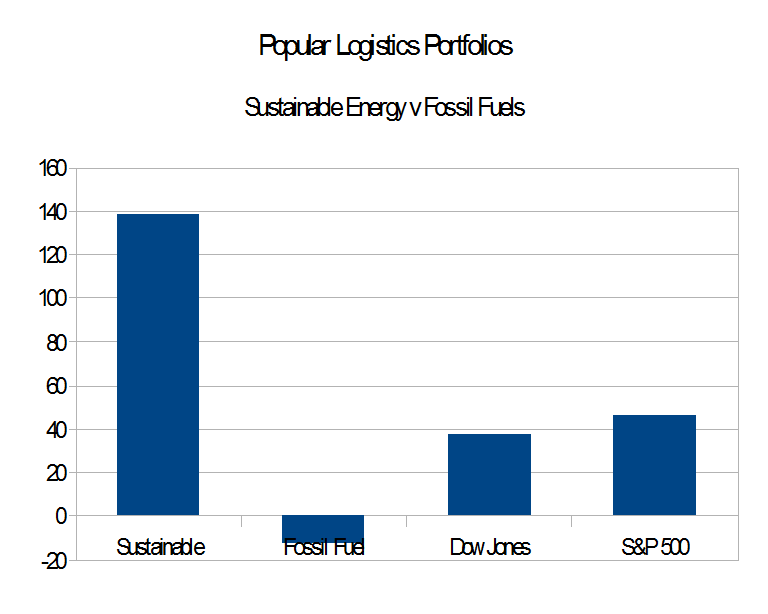
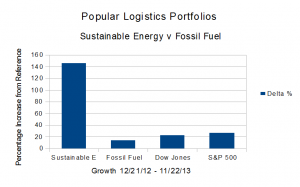
- The Market Capitalization of the sustainable energy companies is up 148.6%, from $39.58 Billion to $98.4 Billion. (See Table 6, below).
- The Market Capitalization of the Fossil Fuel portfolio is DOWN 3.8%, from $1.09 Trillion to $1.05 Trillion. (See Table 7, below).
- And the Market Capitalization of the Big Oil companies is DOWN 2.6%,from $1.03 Trillion on 9/21/17 to $1.007 Trillion on 10/20/17. (See Table 8, below)
In Addition
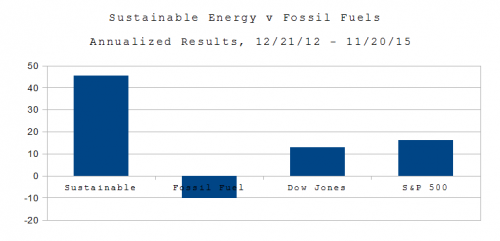
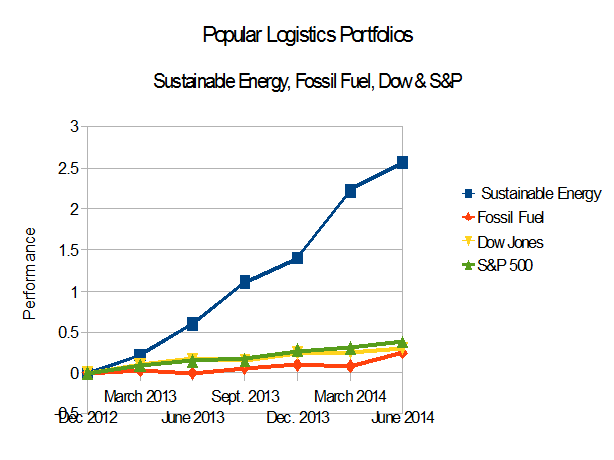
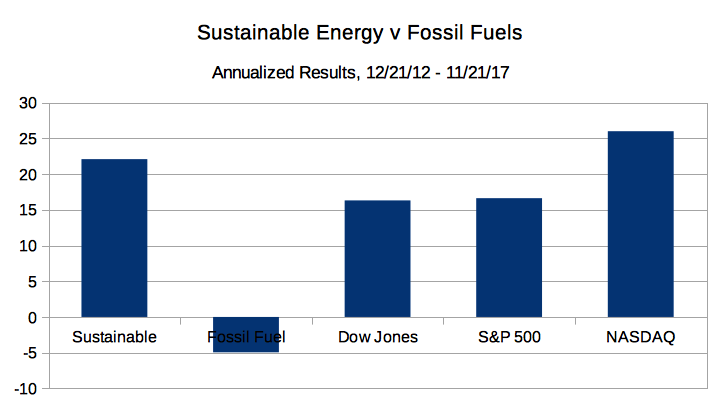
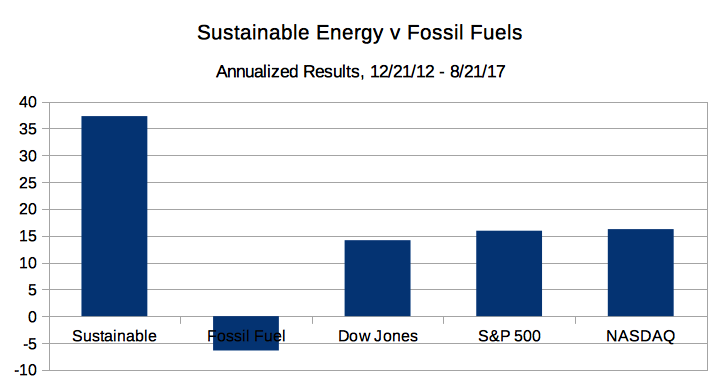
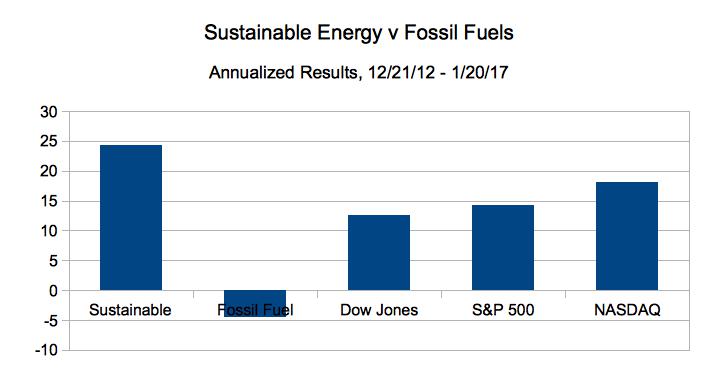
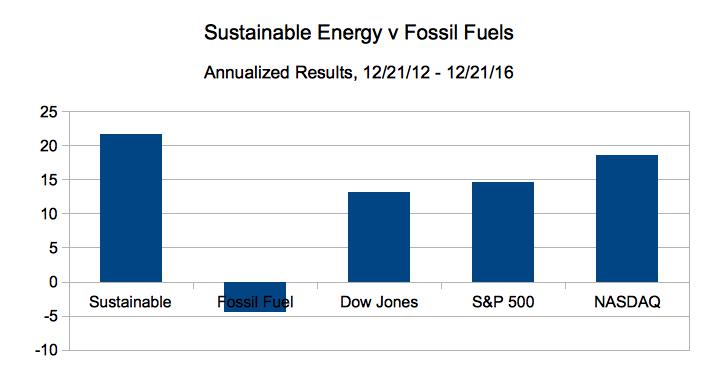
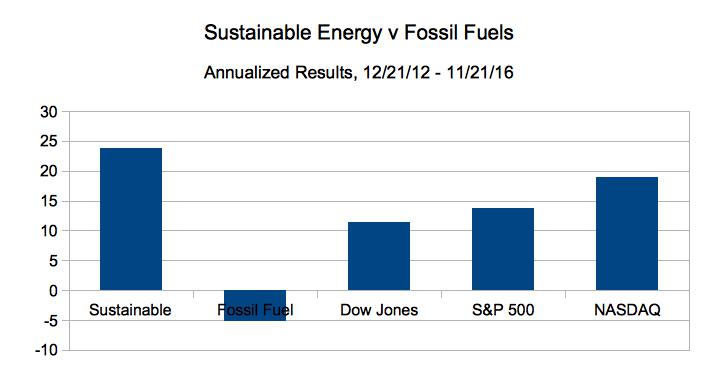
- The Fossil Fuel portfolio went from $8.0 Million to $6.06 Million, down 24.3% overall, down 4.94% on an annualized basis.
- The Sustainable Energy portfolio went from $8 Million to $16.7 Million, up 108.6%, overall and 22.1% on an annualized basis.
- The Dow Jones Industrial Average is up 80.2% overall and 16.31% on an annualized basis; from 13,091 on 12/21/12 to 23,591 on 11/21/17.
- The S&P 500 is up 81.8% overall and 16.63% on an annualized basis, from 1,430 on 12/21/12 to close at 2,599 on 11/21/17.
The details are below.

 As of the close of trading on November 21, 2016:
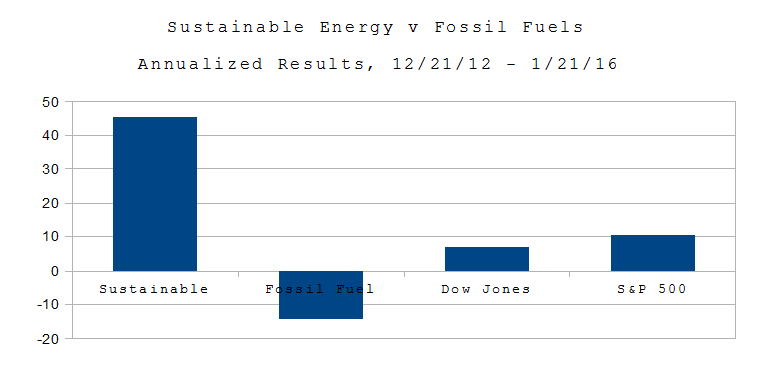 Wall St. 1/21/16. On Dec. 21, 2012, I put $16 Million imaginary dollars in equal imaginary investments in 16 real energy companies; $8.0 in the Sustainable Energy space and $8.0 in the fossil fuel space.