I just bought some LED bulbs at Home Depot. The bulbs, from Cree and Lighting Sciences, are sold under the “ecosmart” ™ brand. The Lighting Sciences bulbs will go into my bathroom. The CREE bulbs will go into the bedrooms, family room, and the kitchen. Over their 35,000 lifespan, each LED bulb will outlast 14 or 15 incandescents, or 4 or 5 compact flourescents and will use 16% of the power of the incandescent bulbs or 75% of the power of the compact flourescents. At $0.14 per kwh, the LEDs will consume $51.45 worth of power over their lifetimes, compared to $68.60 for the CFL’s and $318.50 for the incandescents. This is summarized in Table 1, below.
| Comparison of LED, Incandescent Filiment, and CFL Light Bulbs |
| Description |
Filiment |
CFL |
LED |
| Wattage |
65 |
14 |
10.5 |
| Bulb lifespan (hours) |
875 |
8,000 |
35,000 |
| Electricity (kwh) per 35,000 hours |
2762.5 |
595 |
446.25 |
| Electricity cost at $0.14 / kwh |
$318.50 |
$68.60 |
$51.45 |
| Table 1 |

 These are “Dimmable.” They are also expensive – the 65watt equivalent, rated for 35,000 hours, costs $24.97; the 40watt-equivalent, rated for 50,000 hours, costs $9.97. Lowes and CostCo have similar units. The units from Lowes are currently more expensive. The prices are offset by the electricity savings and durability of the bulbs. These bulbs should last 15 to 20 years. If they are on 4 hours per day. If electricity prices don’t change, the LEDs will cost 3/4 the cost of a CFL and 1/6 the cost of an incandescent. In addition, since they use much less electricity, they will throw off much less heat. Thus, I will also save on air conditioning bills. Since 1 LED bulb will last as long as 4 CFL’s or 15 incandescents, I will also spend much less time changing bulbs – once installed, I expect to change the bulbs, every 15 to 20 years.
Like old fashioned incandescents, invented by Thomas Edison in the 1800’s, and unlike compact flourescents, or CFL’s, LED bulbs use no mercury or lead. They are easy to dispose of; if they break they do not create a toxic waste issue.
They offer three very clear advantages: They use much less power, they last much longer, they release no toxic wastes when they break.
The 65-watt equivalent bulbs, from CREE, produce 575 lumens of light on 10.5 watts of power. They have a 3-year warranty, but as noted, are rated for 35,000 hours of use. They also feature an integrated housing to fit inside a 6″ can or “high hat.” These are dimmable. If on for an hour, each will consume 10.5 watt-hours, 0.0105 kwh.
 The 40-watt equivalent bulbs, from Lighting Sciences, produce 429 lumens of light with 9 watts. Thus, if on for an hour, each will consume 9 watt-hours, or 0.009 kilowatt hours, as opposed to 0.04 kwh. The three used in my bathroom will consume 0.027 kwh, per hour as opposed to 0.12 kwh per hour from the bulbs they are replacing. These are for indoor use only, and should last 50,000 hours. I am concerned about heat dissipation in the fixture, and will probably replace the glass housings.
 This picture shows LED and CFL bulbs in the bathroom at turn-on. Note that there is no “warm-up” time for the LED bulb.
Cree, a $2.5 billion company, trades under the symbol CREE. Its price, at the close of trading, on 12/23/11, was $21.66 per share. It’s 52-week range is $20.25 to $69.21. Cree has an EPS, or earnings per share of $0.92. a P/ E, or price / earnings ratio of 23.60, a debt to asset ratio of 0.00, and net operating margins of 17.08. Cree has 4,753 employees. Institutions own 78% of the company.
Lighting Sciences, a $284 million company, trades under the symbol LSCG. Its price, at the close of trading on 12/23/11, was $1.39 per share. The debt to asset ratio is 8.52. It’s 52-week range is $1.32 to $5.39. The operating margins are negative -122.84, and the EPS is negative: -$2.59. Lighting Sciences has 152 employees. Institutions do not own this company.
This is probably a good time to invest in CREE. It might be a great time to speculate in Lighting Sciences.
The paradigm is shifting. Or, as Dylan once said, “The times, they are a-changin’.”
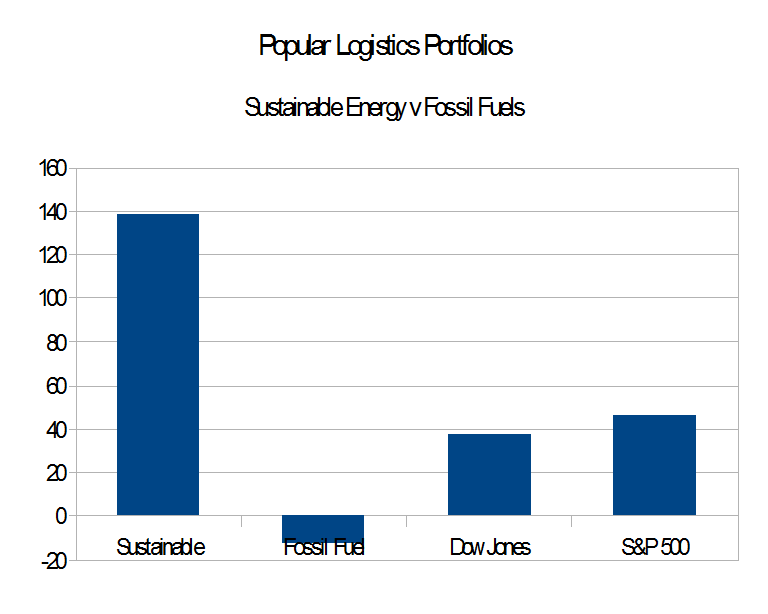
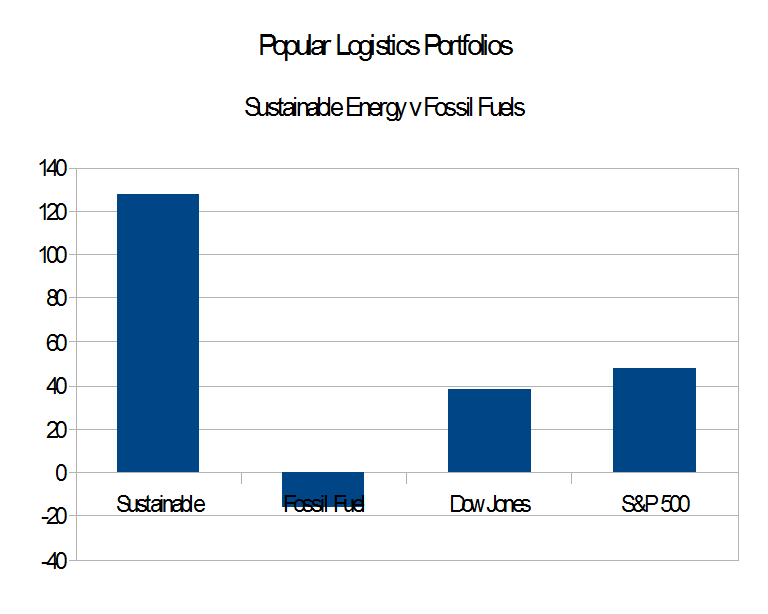
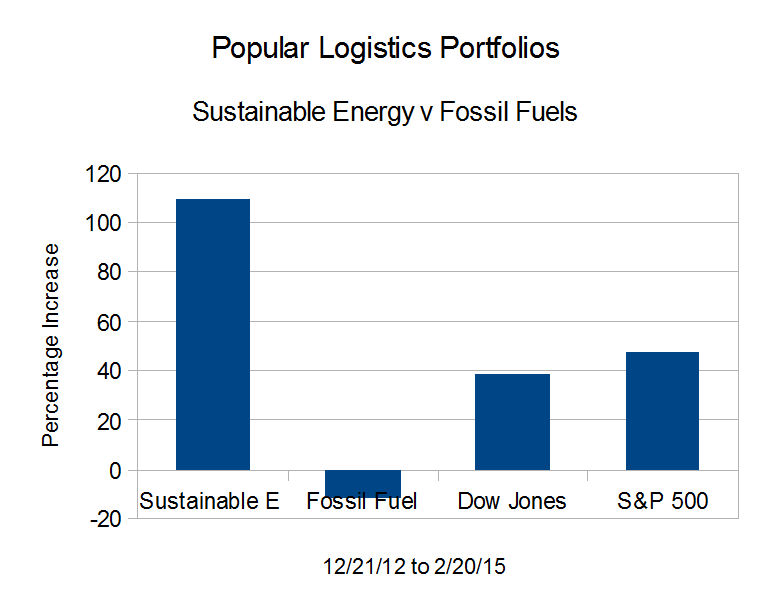
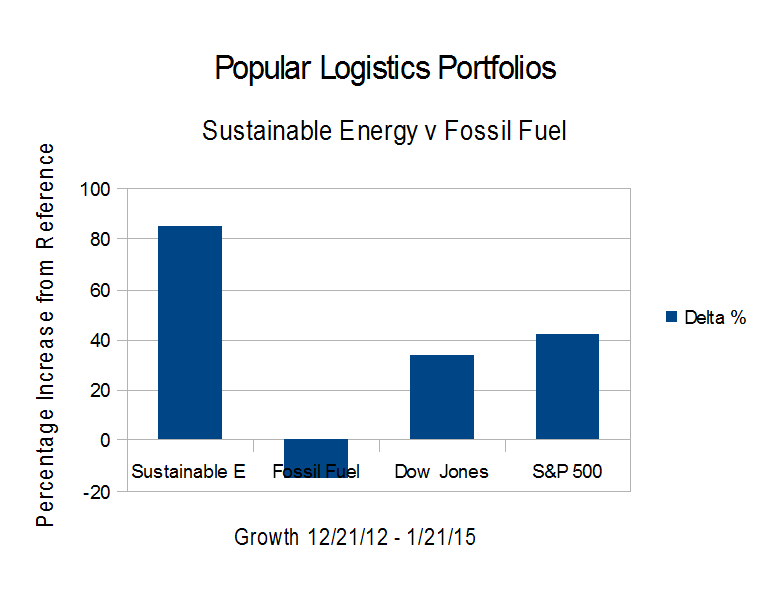
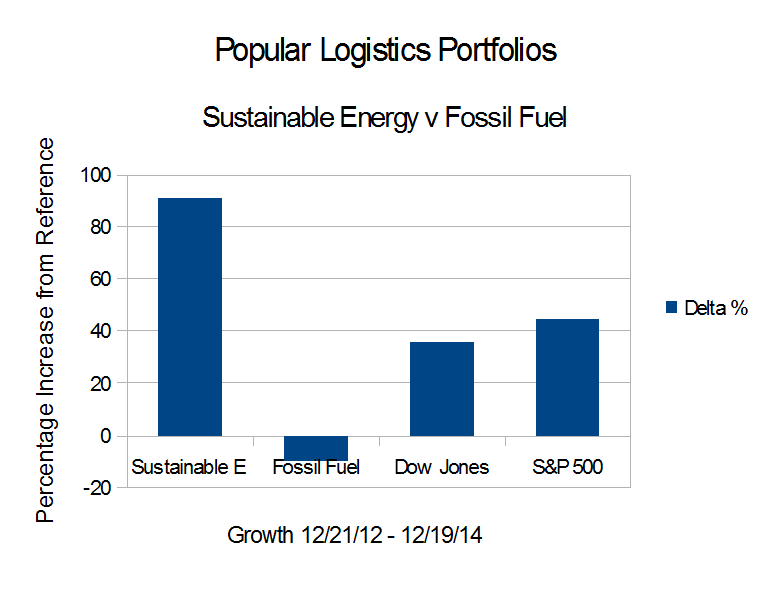
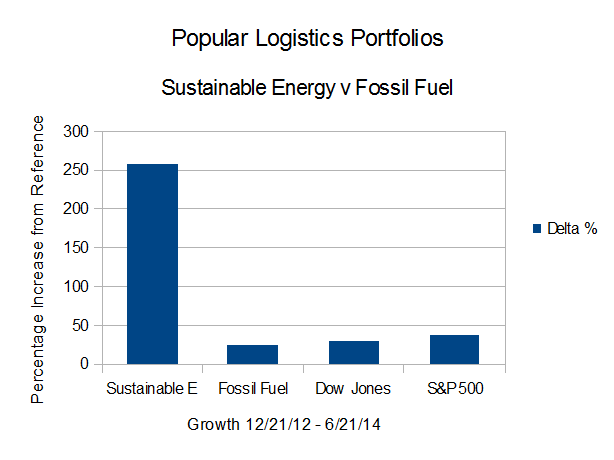
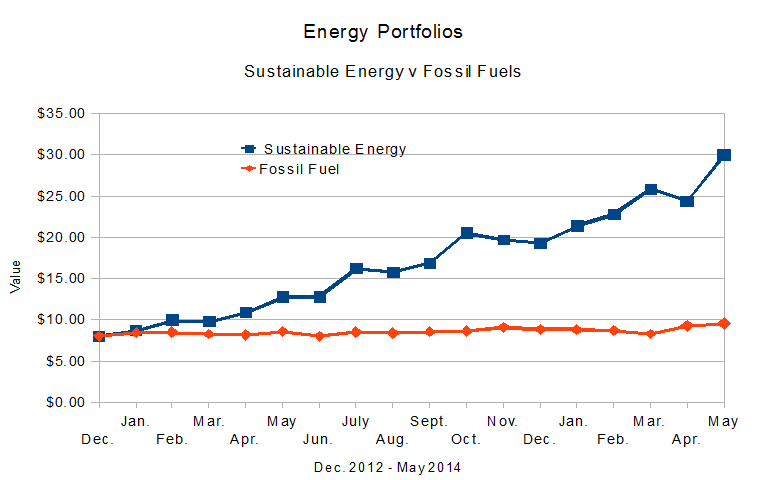
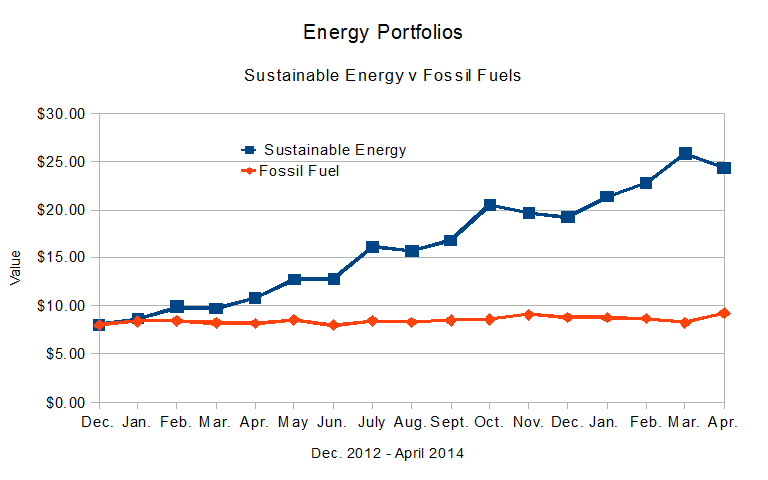
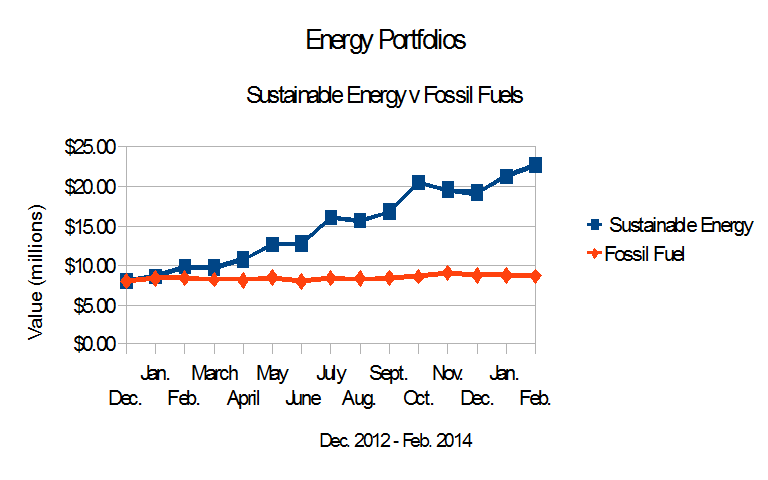
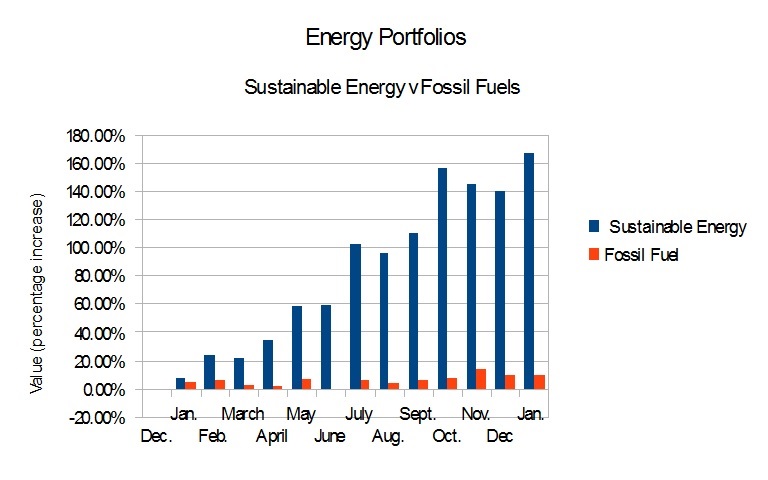
 On Dec. 21, 2012, I put $16 Million imaginary dollars in equal imaginary investments in 16 real energy companies; $8.0 in the Sustainable Energy space and $8.0 in the fossil fuel space. Excluding the value of dividends and transaction costs, but including the bankruptcy or crash of three companies in the sustainable energy space.