“Microsoft sells different flavors of soda. Apple sells water, coffee, tea, beer, wine, vodka, cheese, meats, breads, … and it also sells soda.”
Stock Price and Corporate Valuations
On Oct. 28, 2010, Apple closed at 305.24, about 4% below its the historic high of 319, reached on October 18, 2010. Apple’s earnings per share, EPS, is $15.15. It’s price earnings ratio, P/E, is 20.147. It’s market capitalization is $279.59 Billion.
That same day, Microsoft closed at $26.28, at 45% of it’s historic high of 57.625, reached on 12/17/1999. Microsoft’s EPS is 2.11, P/E ratio is 12.48, and market capitalization is $227.42 Billion, $52 Billion less than that of Apple.
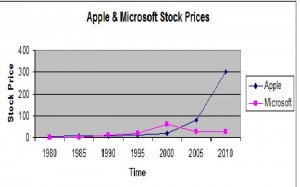
If you look at a graph of their stock prices, Microsoft climbed spectacularly from 1986 to 1999, then plummeted and has been basically flat since it crashed in 2000. Apple climbed much more slowly, until recently, and may still be rising. However, while the graph may tell one thousand words, it doesn’t tell the whole story. And there are two flaws:
- The graph is an approximation of the stock price of AAPL and MSFT from the period of 1980 to 2010. It is neither complete, detailed, or rigorous. Complete details can be found on the Internet. The graph shows that Microsoft grew during the ‘80’s and ‘90’s then spiked dramatically and crashed around 2000. Actual high point was Dec. 17, 1999. The low of 21 reached on Dec. 29, 2000. Apple was doing pretty badly during the ‘90’s, however, since Steve Jobs return in the mid to late 90’s turned around. The stock price increased to 100 in 2007 or 2008 to 318 earlier this month.
- The graph doesn’t show the increase in market capitalization. An investment in Microsoft of about $3,000 at the IPO in March, ’86 would have been worth about $1.0 Million at the peak in Dec. ’99, and would still be worth about $455,000 today, an increase of 15,200%. Apple and Microsoft went from Million-Dollar companies in the early 1980s to companies worth $280 and $227 Billion, respectively today.
But perhaps the real insight is to view of these curves from a systems thinking perspective. Is the Microsoft stock price curve an example of overshoot and collapse? Will it recover or has it reached a steady state? Is Apple peaking? Is it about to collapse? Will it drop, and stabilize, like Microsoft, to a point less than half of it’s peak? And if so, if not now, when? Continue reading
