China Air Pollution 中国空气污染
The Bitter Years Return 的苦涩年返回
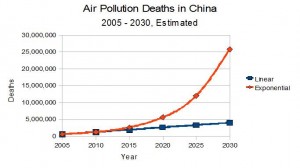
Projection of air pollution deaths in China, based on reported deaths in 2006 and 2010.
During the “Bitter Years” from 1958 to 1962, an estimated 15 to 43 million people died of starvation in China (wikipedia). Mao, who ate well during that time, did not want help from the west. Fast forward to today. It has been reported that due to air pollution, an estimated 650,000 people died in China in 2006, and another estimated 1.2 million died in 2010. Knowing these 2 data points of this dynamic system, we can plot a curve. The blue line assumes a linear curve, the red line, the exponential uptick of a sigmoid curve. Assuming reinforcing feedback, the red curve is more likely.
The three most important questions are
- “How serious is the air pollution?”
- “What will it take before the Chinese government acts?”
- “What will be the delay between action and results?
The short answer to Question 1 is “Very.” If this is as serious as I think it is, the challenge for the government of the People’s Republic of China as for other governments, will be to stop polluting and clean up the pollution it has allowed to be dispersed into the bio-humano-sphere. However, this conflicts with the apparent goal of the Chinese government to be the world’s biggest producer of stuff without regard to pollution.