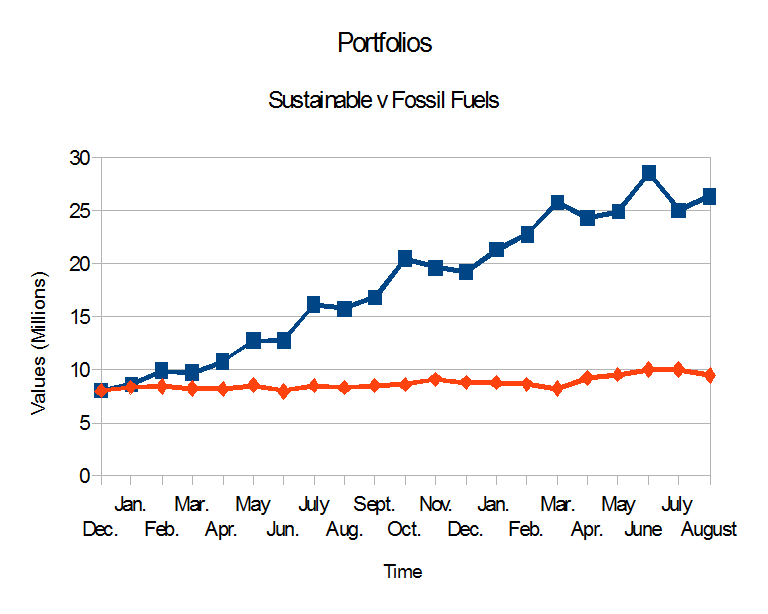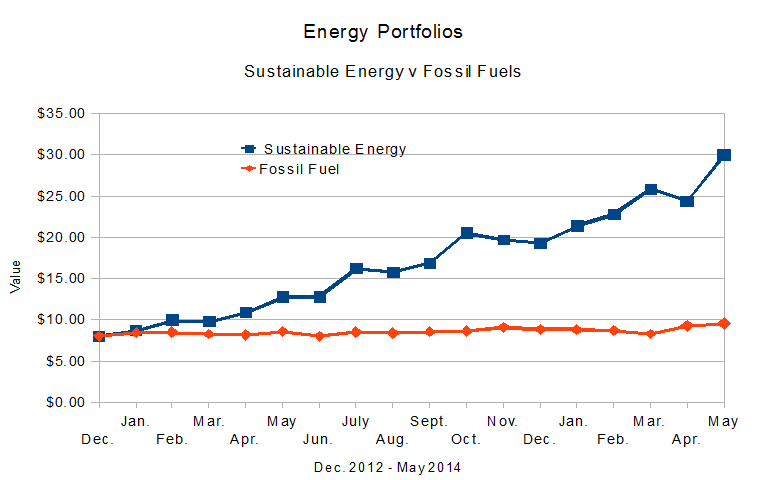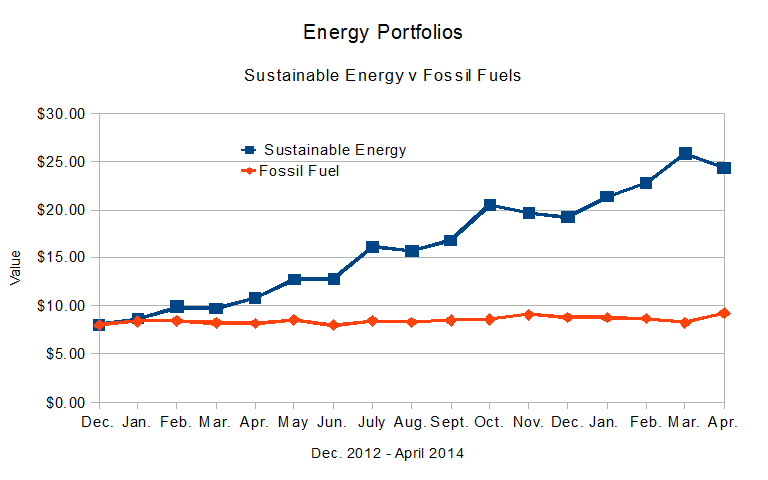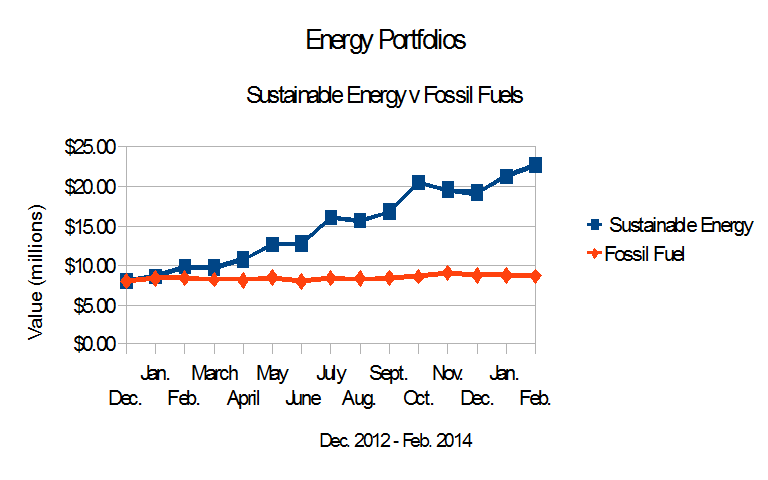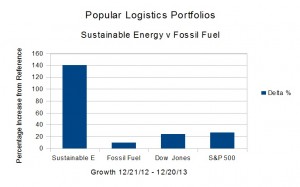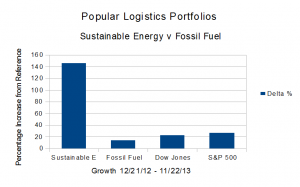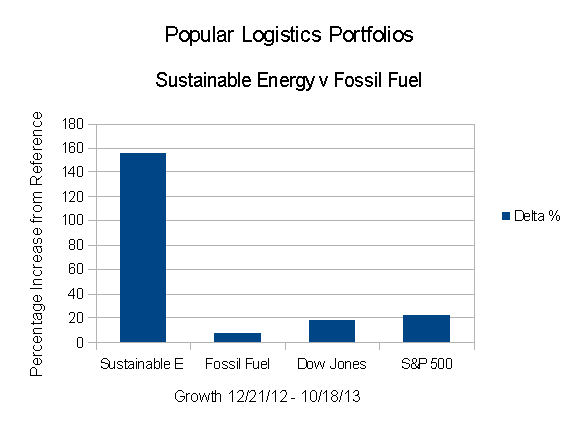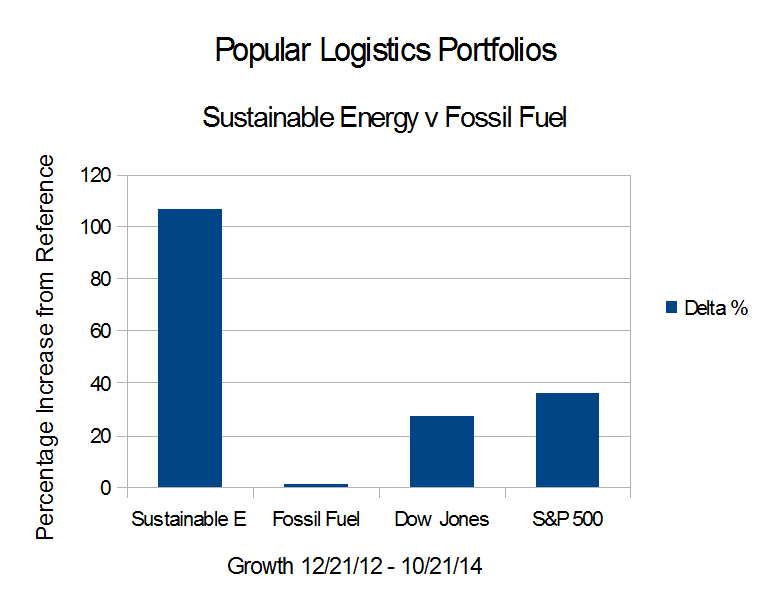
On Dec. 21, 2012, I put $16 Million imaginary dollars in equal imaginary investments in 16 real energy companies; Eight in the Sustainable Energy space and eight in the fossil fuel space. Between December 21, 2012 and October 21, 2014
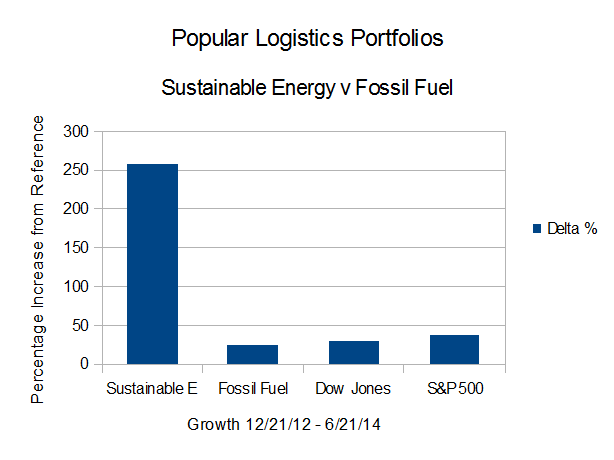
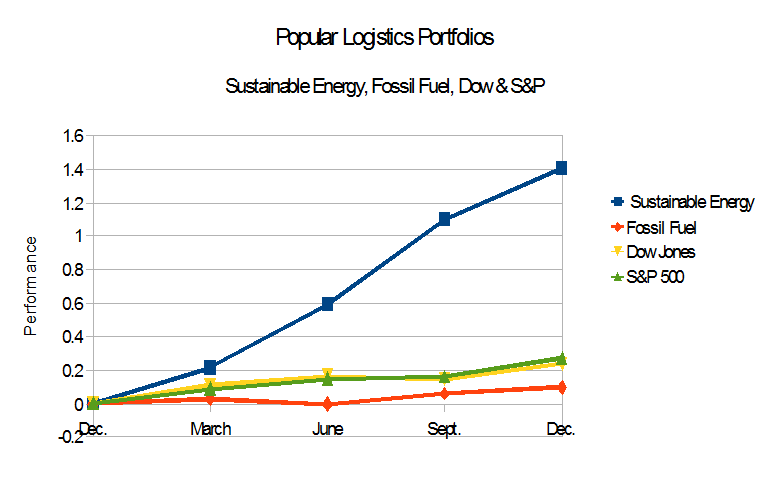
- The Dow Jones Industrial Average is up 26.9%
- The S&P 500 is up 35.75%
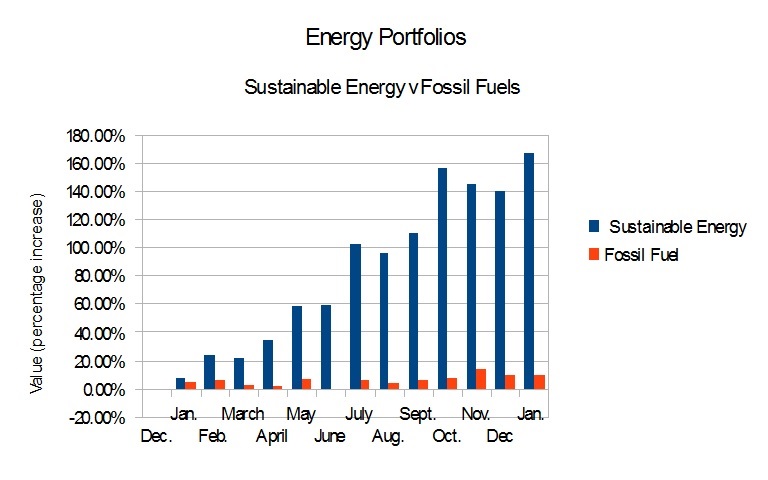
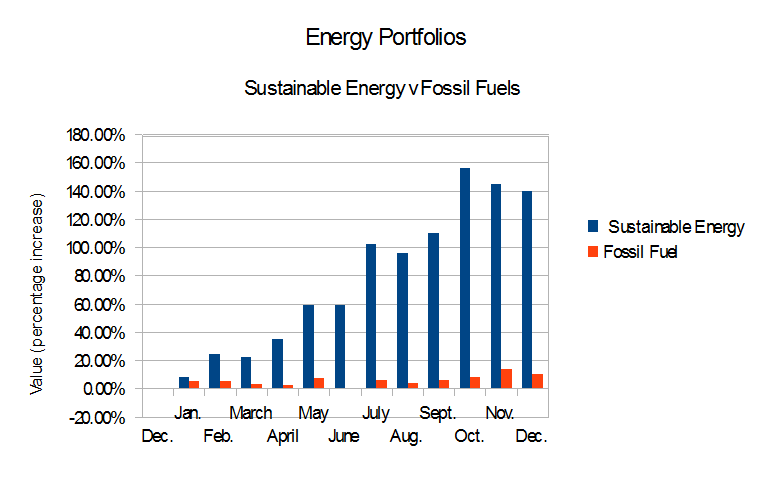
- The Fossil Fuel Portfolio continues to dramatically underperform the reference indices. It is up 1.01%.
- The Sustainable Energy portfolio is up 106.88% from Dec. 21, 2012 but down from August, 2014.
- I was invited to write for “Seeking Alpha.” Some of the data herein was posted as “The Paradigm Is Shifting; Fossil Fuels Are Becoming Fossils” on Seeking Alpha on October 1, 2014. Additional analysis on Cree was posted on Seeking Alpha on 10/7/14, as “Cree: Strong Financials, But … “
By 10/15/14, GT Advanced Tech had filed for bankruptcy protection, and other stocks in the portfolio dropped to points near their Dec. 2012. The portfolio as a whole dropped 55% from Sept. 19, 2014. Stay tuned, and keep your seat belt on. Continue reading