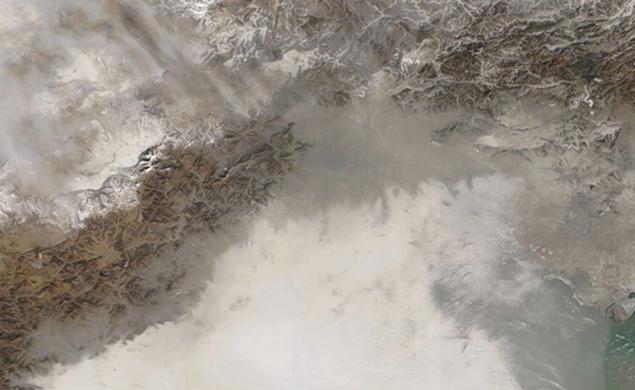
Image 1. Beijing from space, Jan., 2013, courtesy NASA
忘了长城 – 我们现在有大的雾度
“Forget the Great Wall – We Now Have the Great Haze”
– Translation by Google
In the 1960’s and 1970’s astronauts showed that we could see the Great Wall of China from space. Today, it’s the Great Haze of China that we can see from space . The New York Daily News, here, published this image, taken by NASA in January 12, 2013 (here) when the Air Quality Index, AQI, reached 775.
The AQI was established by the US EPA. AQI above 300 is considered dangerous. AQI at 775 is probably deadly.
Beijing is the gray triangular area at the top of Image 1, above. This second image, taken by NASA, in April/May, 1998, (on the web here) shows what Beijing looked like from space in 1998.

Image 2, Beijing, April-May 1998
These images suggest an explanation regarding why 1.2 million people died in China and North Korea in 2010, why mortality has increased from 656,000 deaths in 2006 (according to National Geographic, here) to 1.2 million in 2010 (The Guardian, here) and why mortality and morbidity are increasing, I would expect at an accelerated rate. The NY Daily News also reported that China Daily reported,
“A pediatric hospital in downtown Beijing has treated a record 9,000 children this month, mostly flu, pneumonia, tracheitis, bronchitis and asthma patients.”
Given that the authorities in China view the news media as an expression of the state I have questions as to the exact number of people hospitalized, and the number of people who died due to the pollution. If it’s an even distribution, and the death rate in 2013 will be the same as in 2010, then about 100,000 people died in China and N. Korea in January due to air pollution.
If it’s a linear progression, then the math is easy. 544,000 more people died in 2010 than in 2006, therefore the number of people who die is increasing by 181,000 each year, 15,000 each month. In 2012, therefore, about 1,562,000 people died. About 1.7 million people will die this year (see table 1, below).
| Deaths in East Asia from Air Pollution | ||
| Year | Deaths | |
| 2006 | 656,000 | Ntl Geo |
| 2007 | 837,000 | (est) |
| 2008 | 1,018,000 | (est) |
| 2009 | 1,199,000 | (est) |
| 2010 | 1,200,000 | Guardian |
| 2011 | 1,381,000 | (est) |
| 2012 | 1,562,000 | (est) |
| 2013 | 1,743,000 | (est) |
| Table 1 | ||
This is a lot of people, but is a small percentage of the population – 1.7 million is about 0.13% of 1.3 billion population of China. However, if my estimates are correct, then 9.6 million people will have died from air pollution in the eight years beginning 2006. If this projection is correct, then another 1.9 million will die in 2014, another 2.1 million in 2015, a total of 13.625 million in the 10 years beginning 2006. That’s about 1% of the population DIEING in a 10 year period. That doesn’t count people dieing from water pollution induced disease, automobile accidents, construction accidents, etc.
If the mortality rate is doubling every five to six years then there will be 2.4 million dead from air pollution in 2016, 4.8 million dead from air pollution in 2022, 9.6 million dead from air pollution in 2028. And if these data are based on “Official” information from the Chinese authorities, then we know these estimates are much smaller than what has happened, what is happening and what will actually happen.
–
An analyst and consultant, I hold a Bachelor’s in Biology and an MBA in “Managing for Sustainability” from Marlboro College. I can be reached at ‘L Furman 97” @ G Mail. I am available for consulting to governments of People’s Republic of China, the United States, as well as the United Nations and NGOs. My requirements are modest.