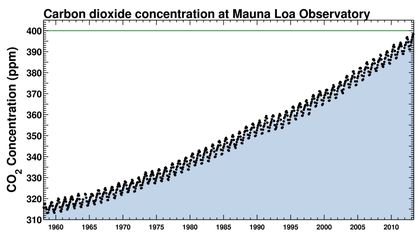
Atmospheric CO2, Measured at Mauna Loa, 1960 – Present
Atmospheric CO2 hit 400 PPM on Thursday, May 9, 2013, as measured at the Koana Loa observatory. This is an increase of 85 ppm, 26.98%, from 1960. This is why Bill McKibben, of 350.org, calls our planet Eaarth. It’s weather, climate, and ecology are different than the one those of us who are over 30 – or over 12 – were born on. National Geographic, summed it up well, here:
“Greenhouse gas highest since the Pliocene, when sea levels were higher and the Earth was warmer.”
The scientists are taking the data – increased atmospheric carbon dioxide – and asking two questions:
- Why is it increasing?
- What are the likely effects?
The journalists and bloggers, like Geoffrey Lean, at the Telegraph, asks, here, “Did the contentious global warming ‘hockey stick’ graph get it right?” He could have asked “Did the scientists – and the environmentalists – get it right? And if so, shouldn’t we stop burning fossil fuels?”
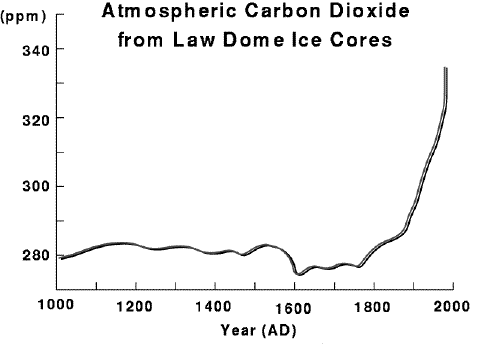
Atmospheric CO2, measured in Lawdome Ice Cores
The graph above, courtesy of Elmhurst College, here, shows the concentration of atmospheric carbon dioxide over the last 1000 years, as measured in Antarctic Ice. Kevin Drum, at Mother Jones sums it up pretty well, here
The “hockey stick” chart of global warming… called that because it shows relatively flat global temperatures over the past millennium followed by a sudden sharp rise over the past century. … based on a reconstruction of enormous amounts of data over a much longer time frame. It very dramatically shows how different the past century is from the past 12,000 years. Over that period, global temperatures gradually rose as we exited our last ice age and then gradually started to fall about 5,000 years ago. But there’s nothing gradual about what happened next: Starting around 1900, global temperatures suddenly spiked almost straight up.
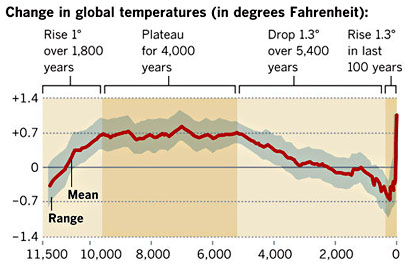
Temperature, last 11,500 years
David Appell, at Scientific American, here, explains the approach by Michael Mann and other scientists,
Mann … is known for the “hockey stick,” a plot of the past millennium’s temperature that shows the drastic influence of humans in the 20th century. Specifically, temperature remains essentially flat until about 1900, then shoots up, like the upturned blade of a hockey stick….
To construct the hockey-stick plot, Mann, Raymond S. Bradley of the University of Massachusetts Amherst and Malcolm K. Hughes of the University of Arizona analyzed paleoclimatic data sets such as those from tree rings, ice cores and coral, joining historical data with thermometer readings from the recent past. In 1998 they obtained a “reconstruction” of Northern Hemisphere temperatures going back 600 years; by the next year they had extended their analysis to the past 1,000 years. In 2003 Mann and Philip D. Jones of the University of East Anglia in England used a different method to extend results back 2,000 years.
In each case, the outcome was clear: global mean temperature began to rise dramatically in the early 20th century. That rise coincided with the unprecedented release of carbon dioxide and other heat-trapping gases into the earth’s atmosphere, leading to the conclusion that industrial activity was boosting the world’s mean temperature.
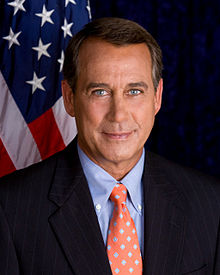
John Boehner, US Speaker of the House
But if the scientists, and the environmentalists, are correct, how do we explain, and respond to, Speaker of the House John Boehner’s statement, on ABC TV, “This Week with George Stephanopoulos,” April 19, 2009, transcript here,
the idea that carbon dioxide is a carcinogen that is harmful to our environment is almost comical. Every time we exhale, we exhale carbon dioxide. Every cow in the world, you know, when they do what they do, you’ve got more carbon dioxide
Actually, the scientists and environmentalists don’t say “carbon dioxide is a carcinogen.” It isn’t. It is, however, a gas that is toxic, and fatal in sufficient concentrations. The lethal concentration, which causes death in 30 minutes, is 10%, 100,000 ppm. Bureau of Land Management, PDF here, The Allegheny County Health Department has a good presentation, PDF here on deaths linked to carbon dioxide. Boehner also misrepresents the systems dynamics of human, and cow respiration. When we exhale carbon dioxide, it is part of a continuous cycle.
Closed Loop Cycle
This is elementary ecology, but it appears that Mr. Boehner doesn’t understand it.
- We Inhale Oxygen,
- We eat carbon based foods,
- We Metabolize said foods,
- We release carbon dioxide other metabolic wastes into the biosphere.
- Plants take up the carbon dioxide – turning it into wood, leaves, fruits, grains, vegetables, etc.
- Bacteria consume the metabolic wastes.
Mr. Boehner should also note that the bubonic plague is also natural. And the idea that the Speaker of the House of Representatives should be so ignorant of basic science would be an unbelievable premise in a film. The fact that it’s true is pathetic and frightening. Think Progress has compiled a list of 99 statements about climate change, here.
Bill McKibben
This is why atmospheric carbon dioxide varies during the year – there is more in late winter, less in late summer / early fall because carbon is sequestered in new growth of trees and other plants. Cows, and humans, take carbon out of the biosphere in the food we eat and as we grow, and put it back into the air when we exhale. But the 7.9 million barrels of oil we burned in 2012 (US EIA, here) was oil that had been sequestered underground 65 million to 180 million years ago, in the The Jurassic (180 million to 140 million years ago) and Cretaceous (140 million to 65 million years ago) periods (See “Method for age-dating oil is developed“, Stanford University News Service, 8/4/94, here. Current thinking on oil formation is discussed by William Broad, on the NY Times, here.
It’s ironic, but a graph shaped like a hockey stick explains why we won’t be playing hockey on natural ice much in New Jersey, Pennsylvania, Ohio, Minnesota, and other states where winter temperatures will rarely stay below freezing long enough for lakes and ponds to freeze over sufficiently for hockey and other winter sports .
–
A candidate for General Assembly (Site / Join / Contribute) to represent NJ Legislative District 12, which stretches from Matawan to to New Hanover and includes Old Bridge, Manalapan, Englishtown, Roosevelt, Millstone, Jackson, and various other towns (click here), and an analyst with Popular Logistics, Lawrence J. Furman holds a Bachelor’s in Biology, and an MBA in “Managing for Sustainability” from Marlboro College, Vermont. He also has experience in information technology. He can be reached at ‘Larry” at Furman For New Jersey. com.