Tag Archives: NOAA

Celestial Shooting Gallery, Part Three: When a CME Hits the Atmosphere

Failed GSU transformer at Salem River, NJ

A Generator Step Up (GSU) transformer failed at the Salem River Nuclear Plant during the March 1989 geomagnetic storm. The unit is depicted on the left; some of the burned 22kV primary windings are shown on the right. Though immersed in cooling oil, the windings became hot enough to melt copper, at about 2000 degrees F. John Kappenman, Metatech

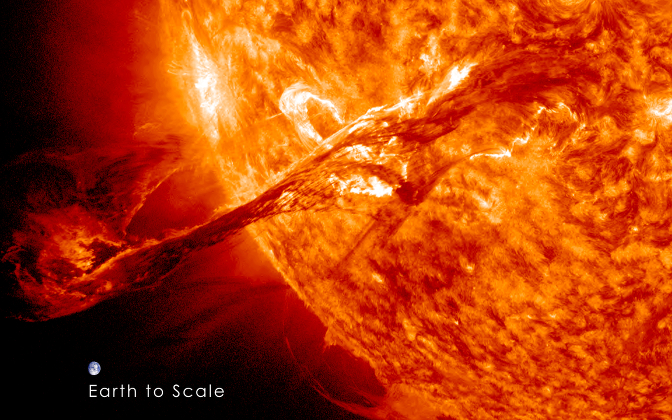
Coronal Mass Ejections are mainly charged particles, protons and electrons. When a CME arrives at Earth, the charged protons and electrons come under the influence of the Earth’s own magnetic field, the magnetosphere. Charged particles spin around the lines of magnetic force that comprise the magnetosphere, which diverts most of CME harmlessly around the planet, keeping Earth’s surface tranquil.

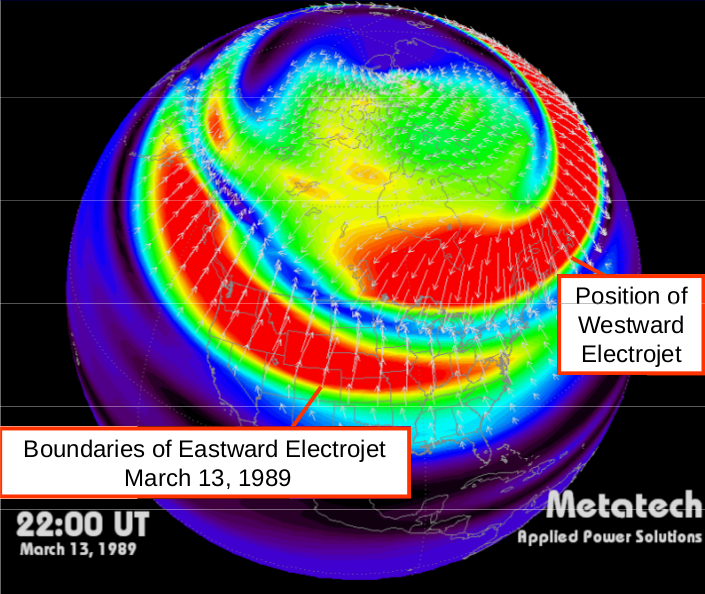
If the ejection is large enough, however, it can distort the shape of the magnetosphere, occasionally causing magnetic flux lines to snap and reconnect. When this happens, charged particles leak in and follow the magnetosphere’s flux lines down to the Earth’s ionosphere. There, they strike oxygen and nitrogen molecules and strip them of electrons. These ionized gases glow, giving rise to the ethereal beauty of the auroras around the north and south poles. Unfortunately, these excess charged particles also produce immense electrojets.

Continue reading

Celestial Shooting Gallery, Part Two: The Physics of Geomagnetic Storms

goddard_cme_earth

On August 31, 2012 a long filament of solar material that had been hovering in the sun’s atmosphere, the corona, erupted out into space at 4:36 p.m. EDT. The coronal mass ejection, or CME, traveled at over 900 miles per second. The CME did not travel directly toward Earth, but did connect with Earth’s magnetic environment, or magnetosphere, causing aurora to appear on the night of Monday, September 3. The image above includes an image of Earth to show the size of the CME compared to the size of Earth. NASA Goddard Spaceflight Center

Thursday, May 2nd, 2013, a coronal mass ejection (CME) hurled nearly one billion tons of charged particles from the sun’s corona at an outward velocity of one million miles per hour – 270 miles per second.

In less than a half hour, 2,700 virtual Empire State Buildings, 340,000 tons apiece – give or take a few gorillas – erupted from an active region of the Sun’s surface called AR1748, a northern latitude sunspot. AR1748 had just become visible on the western limb of the Sun’s surface when it ejected this mass, so the vast bulk of it hurled outward, not toward us in Libra, but more or less toward Cancer, at right-angles to us. In practical terms, it shot wide of its mark. Still an impressive shot. The CME had been triggered by an M class solar flare, the second largest in a five step scheme (An, Bn, Cn, Mn, Xn; for n a relative magnitude). It had been the largest coronal mass ejection observed thus far in 2013.

And it was still early in the day for AR1748.

Continue reading

Celestial Shooting Gallery, Part One: The Day We Lost Quebec

Electrojets over N. America

John Kappenman reconstructed the electrojets which formed in the ionosphere late in the March 13, 1989 geomagnetic storm which compromised the Hydro-Quebec power grid in Canada. Concurrently, the eastward jet induced ground currents that severely strained the electrical distribution grid of northern continental United States, resulting in a transformer failure at the Salem Nuclear Power Plant, in New Jersey. Courtesy of Metatech

Nearly a quarter century ago, on March 13, 1989,  a geomagnetic storm led to the collapse of the Hydro-Quebec electrical grid system, which furnishes power to much of the province of Quebec, Canada. So pervasive were abnormal currents, that protective circuit breakers tripped throughout the system, bringing the entire grid to a halt in about one and a half minutes. The grid’s self-protective systems were geared toward local abnormalities happening in particular places. In contrast, ground induced currents created abnormalities everywhere. The good news was that most of the hardware protected itself. The bad news was that six million customers were without power for as long as nine hours, and where transformer damage did occur, outages continued for another week.

Further south, the United States experienced a close shave. A second surge in the March 13 storm generated similar ground induced currents in the northern United States, with large current spikes observed from the Pacific Northwest to the mid-Atlantic states, one spike destroying a large GSU transformer at the Salem Nuclear Power Plant in New Jersey. According to John Kappenman, of the Metatech Corporation “It was probably at this time that we came uncomfortably close to triggering a blackout that could have literally extended clear across the country.”

Continue reading

Typhoon Mirinae satellite imagery; Philippines events

Typhoon Mirinae on 28 October. Speed 98 mph, gusts up to 121 mph. Via NOAA's OSEI program

Typhoon Mirinae on 28 October. Speed 98 mph, gusts up to 121 mph. Via NOAA's OSEI program

Alertnet advises Mirinae is likely to hit the Philippines on 30 October.

AlertNet main page.

Further information available at Tropical Storm Risk, [http://tropicalstormrisk.com]

See also:

PHILIPPINES: Flood victims grapple with LeptospirosisPHILIPPINES: Flood victims grapple with Leptospirosis

Additional information/images via Earth Snapshot:

20091027-mirinae-full

Philippines sends relief teams in path of typhoon Reuters, on Thu, 29 Oct 2009 05:02:27 -0700

Emergency and rescue teams were also sent to areas directly in the path of Typhoon Mirinae, including major rice-producing provinces north of Manila,


NOAA: El Nino Southern Oscillation

Via the National Oceanic and Atmospheric Administration, El Niño returns in July 2009

NOAA announced on July 9, 2009 that the climate phenomenon called El Niño has returned. The El Niño Southern Oscillation is characterized by low ocean surface winds along the Equatorial Pacific, generating warmer than average ocean temperatures. These warmer temperatures are visible in sea surface temperature anomaly data, such as is shown in this animation.

See link for animation.  El Niño returns in July 2009