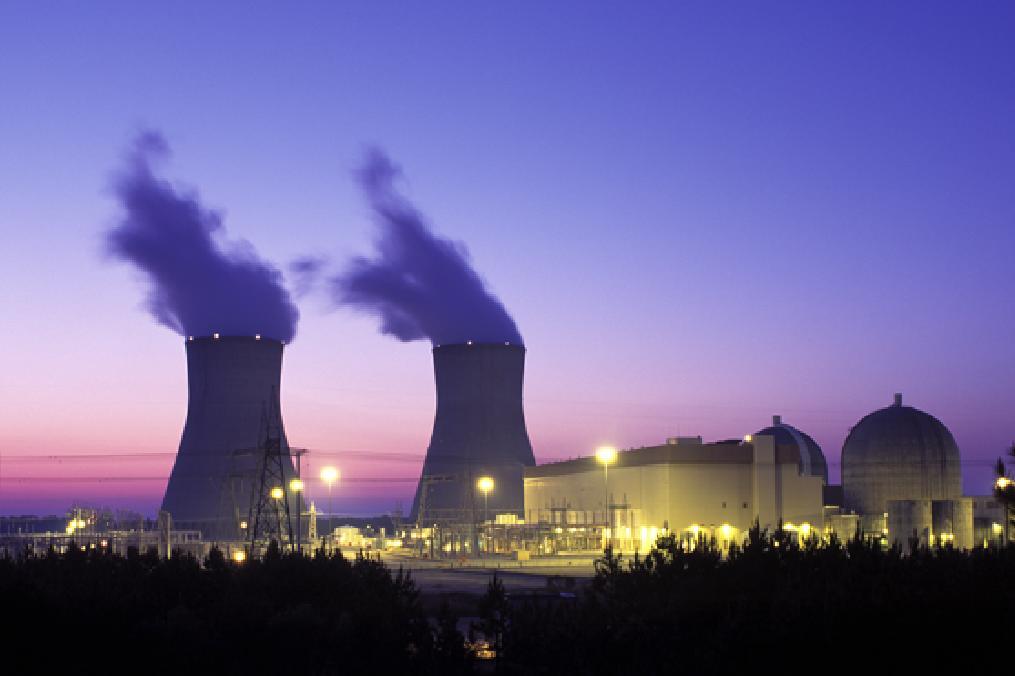
Vogtle nuclear plants 3 and 4 are now forecast to cost a total of $34 Billion. $30.34 Billion (USNews and GPB), plus the $3.68 Billion Westinghouse paid to the owners in conjunction with it’s bankruptcy filing (GTTSI), that’s $34.02 Billion, $14 per watt.
Continue readingCategory Archives: Economics
Energy Portfolios, 4 Years, 6 Months: Sustainable Energy Up 146.9%, Fossil Fuel DOWN 29.8%
On Dec. 21, 2012, I began an experiment in “Sustainable Capitalism” or “Sustainable Finance.” I put $16 Million imaginary dollars in equal imaginary investments in 16 energy companies, $8.0 Million in $1.0 Million investments in eight “Sustainable” energy companies, the other $8.0 Million in $1.0 Million chunks in fossil fuel companies.
As of the close of trading 54 months later,
- The Market Capitalization of the sustainable energy companies is up 140.6%, from $39.58 Billion to $95.1 Billion. (See Table 6, below).
- The Market Capitalization of the Fossil Fuel portfolio is DOWN 10.38%, from $1.09 Trillion to $976.13 Billion. (See Tables 7 & 8, below).
This excludes the value of dividends and transaction costs, but including the bankruptcy or crash of three companies in the sustainable energy space …
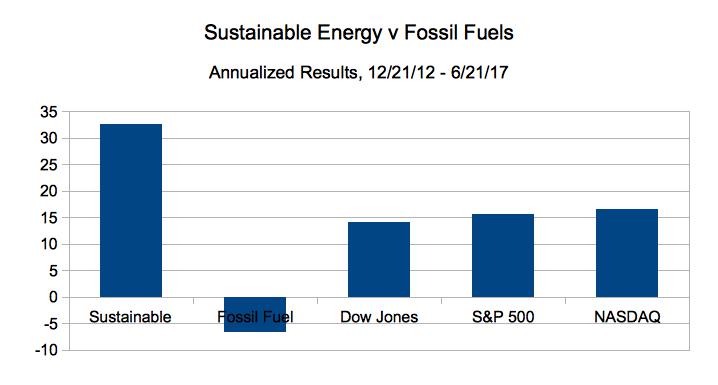
As of the close of trading on June 21, 2017:
- The Fossil Fuel portfolio went from $8.0 Million to $5.617 Million, down 29.8% overall, down 6.62% on an annualized basis.
- The Sustainable Energy portfolio went from $8 Million to $19.75 Million, up 146.8%, overall and 32.6% on an annualized basis.
- The Dow Jones Industrial Average is up 63.55% overall and 14.12% on an annualized basis; from 13,091 on 12/21/12 to 21,410 on 6/21/17.
- The S&P 500 is up 70.35% overall and 15.6% on an annualized basis, from 1,430 on 12/21/12 to close at 2,436 on 6/21/17.
Energy Portfolios, 4 Years, 5 Months: Sustainable Energy Up 148.4%, Fossil Fuel DOWN 24.9%
At 4 Years, 5 Months:
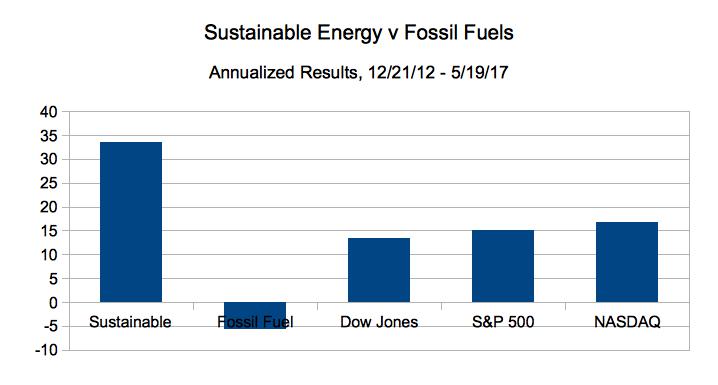
- Sustainable Energy UP 148.4%, 33.6% per year.
- Fossil Fuel DOWN 24.9%, DOWN 5.6% per year.
- The S&P 500 UP 66.6%, 15.1% per year.
On Dec. 21, 2012, I put $16 Million imaginary dollars in equal imaginary investments in 16 real energy companies; $8.0 in the Sustainable Energy space and $8.0 in the fossil fuel space. Excluding the value of dividends and transaction costs, but including the bankruptcy or crash of three companies in the sustainable energy space,
As of the close of trading on May 19, 2017:
- The Fossil Fuel portfolio went from $8.0 Million to $6.005 Million, down 24.9% overall, down 5.6% on an annualized basis.
- The Sustainable Energy portfolio went from $8 Million to $19.87 Million, up 148.4%, overall and 33.6% on an annualized basis.
- The Dow Jones Industrial Average is up 58.93% overall and 13.3% on an annualized basis; from 13.091 on 12/21/12 to 20,805 on 5/19/17.
- The S&P 500 is up 66.57% overall and 15.1% on an annualized basis, from 1,430 on 12/21/12 to close at 2,382 on 4/19/17.
Energy Portfolios, 4 Years, 4 Months: Sustainable Energy Up 126.7%, Fossil Fuel DOWN 26.9%
Energy Portfolios, 4 Years, 4 Months:
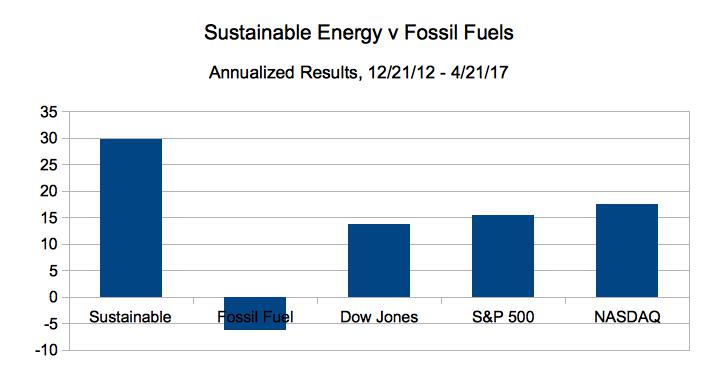
- Sustainable Energy Up 126.7% == 29.23% on an Annualized Basis.
- Fossil Fuel DOWN 26.9% == 6.21% Annualized.
- S&P 500 Up 64.27% == 14.63% Annualized.
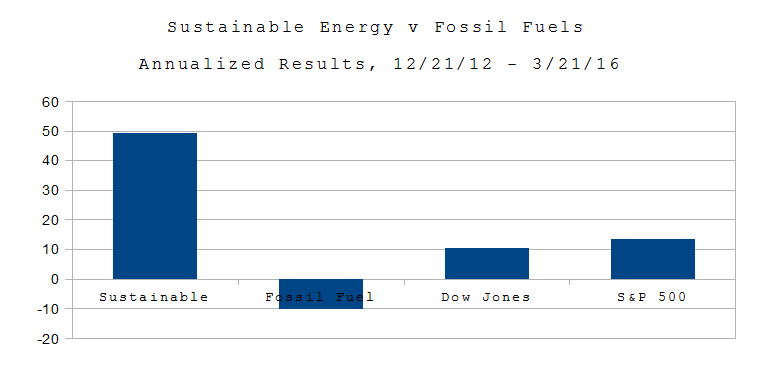
On Dec. 21, 2012, I put $16 Million imaginary dollars in equal imaginary investments in 16 real energy companies; $8.0 in the Sustainable Energy space and $8.0 in the fossil fuel space. Excluding the value of dividends and transaction costs, but including the bankruptcy or crash of three companies in the sustainable energy space.
As of the close of trading on April 21, 2017:
- The Fossil Fuel portfolio went from $8.0 Million to $5.848 Million, down 26.9% overall, down 6.2% on an annualized basis.
- Peabody Coal has Reorganized*. The market cap went from $6 Billion in Dec. 2012 to zero in April of this year.
- The Sustainable Energy portfolio went from $8 Million to $18.1 Million, up 126.7%, overall and 29.23% on an annualized basis.
- The Dow Jones Industrial Average is up 56.96% overall and 13.49% on an annualized basis, went from 13.091 on 12/21/12 to 20,548 on 4/21/17.
- The S&P 500 is up 64.27% overall and 14.83% on an annualized basis, from 1,430 on 12/21/12 to close at 2,349 on 4/21/17.
Energy Portfolios, 4 Years, 3 Months: Sustainable Energy Up 120.9%, Fossil Fuel DOWN 25.1%
On Dec. 21, 2012, I put $16 Million imaginary dollars in equal imaginary investments in 16 real energy companies; $8.0 in the Sustainable Energy space and $8.0 in the fossil fuel space. Excluding the value of dividends and transaction costs, but including the bankruptcy or crash of three companies in the sustainable energy space,
As of the close of trading on March 21, 2017:
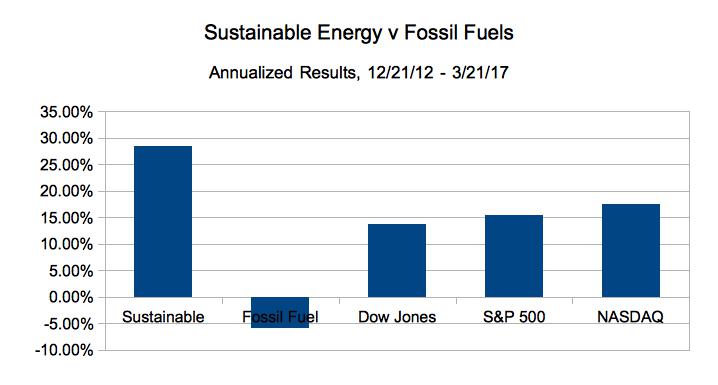
- The Fossil Fuel portfolio went from $8.0 Million to $5.995 Million, down 25.05% overall, down 5.9% on an annualized basis.
- The Sustainable Energy portfolio went from $8 Million to $17.7 Million, up 120.9%, overall and 28.43% on an annualized basis.
- The Dow Jones Industrial Average is up 58.45% overall and 13.75% on an annualized basis, went from 13.091 on 12/21/12 to 20,743 on 3/21/17.
- The S&P 500 is up 65.38% overall and 15.38% on an annualized basis, from 1,430 on 12/21/12 to close at 2,365 on 3/21/17.
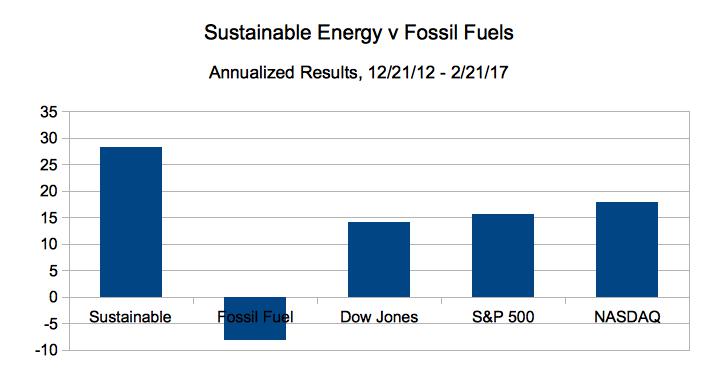
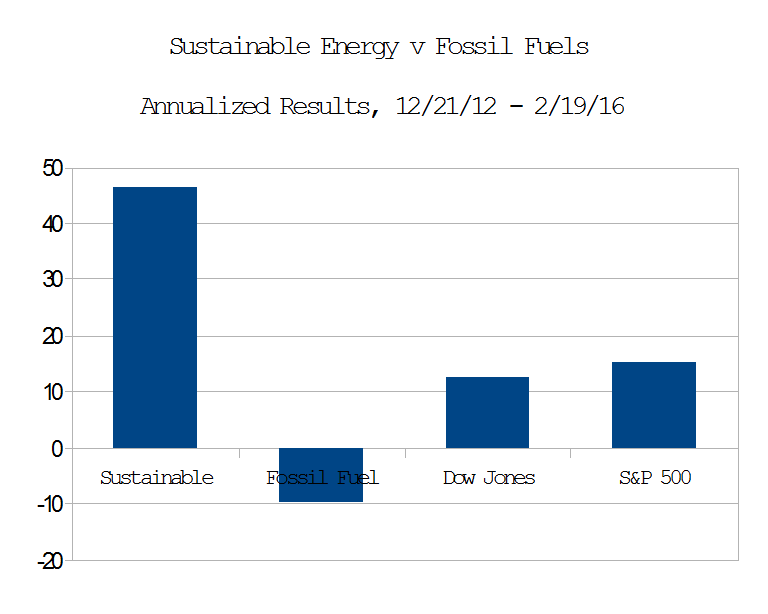
Energy Portfolios: 4 Years, 2 Months: Sustainable Energy up 117.25%, Fossil Fuel Down 33.99%
As of the close of trading on February 21, 2016:
- The hypothetical value of the Fossil Fuel portfolio is down 33.99% overall, from $8.0 Million to $5.28 Million. This is a collapse of -8.16% on an annualized basis.
- The aggregate Market Captalization of the companies in the Fossil Fuel portfolio, as of the close of trading on March 3, 2017, dropped 8.68%, from $1.089 Trillion to $994.6 Billion.
- The hypothetical value of the Sustainable Energy portfolio has more than doubled since Dec. 2012. Up 117.25% overall and 28.14% on an annualized basis, from $8 Million to $17.38 Million.
- The aggregate Market Capitalization of these companies, as of the close of trading on 3/3/17, increased 114.46%, from $39.58 Billion to $84.88 Billion
- As of the close of trading on March 3, 2017, the Market Capitalization of the companies in the Sustainable Energy portfolio increased 114.46% from $39.58 Billion to $84.88 Billion.
In Comparison:
- The Dow Jones Industrial Average is up 58.45% overall and 14.03% on an annualized basis from 13.091 on Dec. 21, 2012 to 20,743 on Feb. 21, 2017.
- The S&P 500 is up 58.45% overall and 15.69% on an annualized basis, from 1,430 to 2,365.
- The NASDAQ is up 94.17% overall and 22.60% on an annualized basis, from 3,021 to 5,866.
Energy Portfolios 4 Years: Sustainable Energy Up 87%, Fossil Fuel DOWN 18%
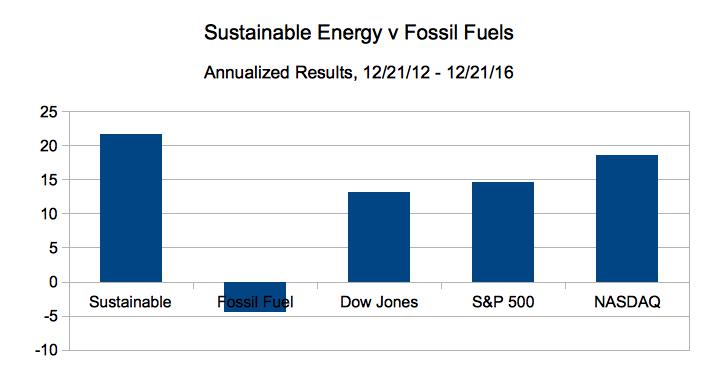
As of the close of trading on December 21, 2016:
- The Fossil Fuel portfolio is up to a point where it is only down 18% overall, from $8.0 Million to $6.56 Million. This is a collapse of -4.5% on an annualized basis.
- The Sustainable Energy portfolio is up 86.75% overall and 21.69% on an annualized basis, from $8 Million to $14.94 Million.
- The Dow Jones Industrial Average is up 52.33% overall and 13.1% on an annualized basis from 13.091 on Dec. 21, 2012 to 19,942 on Dec. 21, 2016.
- The S&P 500 is up 58.38% overall and 14.6% on an annualized basis, from 1,430 to 2,265.
- The NASDAQ is up 74.54% overall and 18.6% on an annualized basis, from 3,021 to 5,257.
Energy Portfolios: 3 Years, 10 Months: Sustainable Energy Up 130%, Fossil Fuel DOWN 26%
On Dec. 21, 2012, I imagined $16 Million dollars in equal investments in 16 real energy companies; eight Sustainable Energy companies and eight Fossil Fuel companies. Excluding the value of dividends and transaction costs, but including the bankruptcy or crash of three companies in the sustainable energy space,
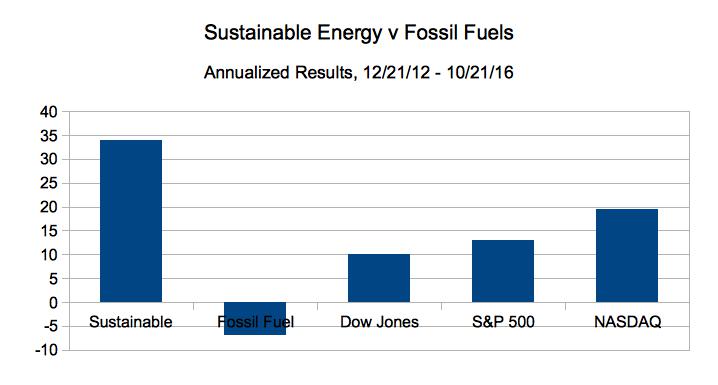
As of the close of trading on October 21, 2016:
- The Fossil Fuel portfolio had a good month, up $399,427, or 7.24$ since Sept, 21, 2016, it is down 26% overall, and 6.8% on an annualized basis, from $8.0 Million to $5.9 Million,
- The Sustainable Energy portfolio is up 130.0% overall and 33.9% on an annualized basis, from $8 Million to $18.4 Million.
- The Dow Jones Industrial Average is up 38.6% overall and 10.1% on an annualized basis from 13.091 to 18,146.
- The S&P 500 is up 49.7% overall and 12.97% on an annualized basis, from 1,430 to 2,141.
- The NASDAQ is up 74.0% overall and 19.44% on an annualized basis, from 3,021 to 5257.
Energy Portfolios: 3 Years, 6 Months: Sustainable Energy Up 125.2%, Fossil Fuel DOWN 25.98%
On Dec. 21, 2012, I imagined $16 Million dollars in equal investments in 16 real energy companies; $1.0 M in each company in each of eight companies in the Sustainable Energy space and $1.0 M each of eight companies in the fossil fuel space. Excluding the value of dividends and transaction costs, but including the bankruptcy or crash of various companies in the sustainable energy space and coal industry.
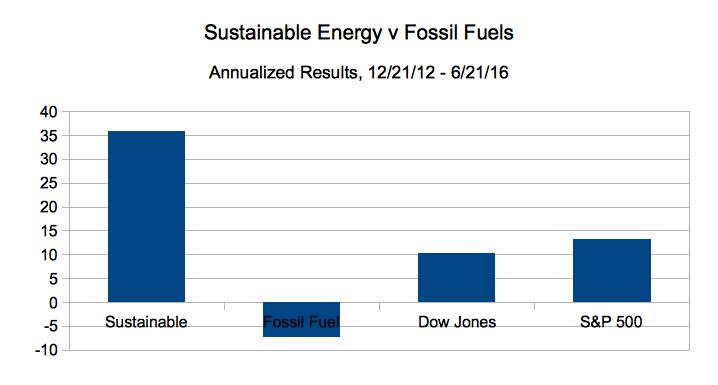
As of the close of trading on June 21, 2016:
- The Fossil Fuel portfolio went from $8.0 Million to $5.92 Million, down 25.98% overall, and 7.4% on an annualized basis.
- The Sustainable Energy portfolio went from $8 Million to $18.019 Million, up 125.24%, overall and 35.8% on an annualized basis.
- The Dow Jones Industrial Average is up 36.2% overall and 10.3% on an annualized basis, went from 13.091 on 12/21/12 to 17,501 on 6/21/16.
- The S&P 500 is up 446.08% overall and 13.2% on an annualized basis, from 1,430 on 12/21/12 to close at 2089 on 6/21/16.
Energy Portfolios, 3 Years, 4 Months: Sustainable Energy Up 139%, Fossil Fuel DOWN 29.3%
On Dec. 21, 2012, I put $16 Million imaginary dollars in equal imaginary investments in 16 real energy companies; $8.0 in the Sustainable Energy space and $8.0 in the fossil fuel space. Excluding the value of dividends and transaction costs, but including the bankruptcy or crash of three companies in the sustainable energy space, and one company in the fossil fuel space.
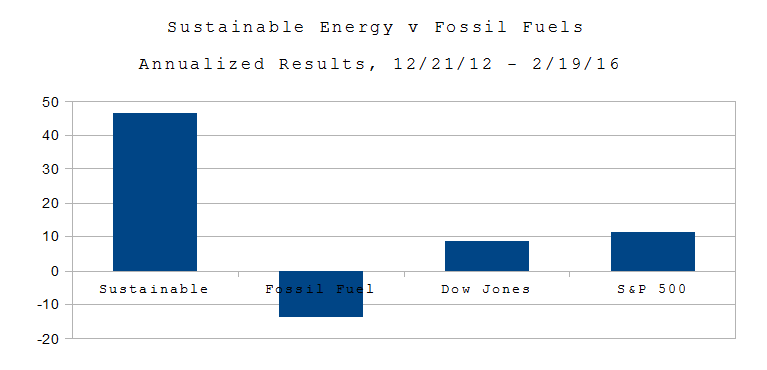
The big news this month is the bankruptcy filing of Peabody Coal (Bloomberg, here). Continue reading
Energy Portfolios, 3 Years, 3 Months: Sustainable Energy Up 159.7%, Fossil Fuel DOWN 33.2%
On Dec. 21, 2012, drying off from Sandy, after the lights came back on, I put $16 Million imaginary dollars in equal imaginary investments in 16 real energy companies; $1.0 Million in each of eight companies in the Sustainable Energy space and another $1.0 in each of eight companies in the fossil fuel space. Excluding the value of dividends and transaction costs, but including the bankruptcy or crash of three companies in the sustainable energy space,
Energy Portfolios, 3 Years, 2 Months: Sustainable Energy Up 139.5%, Fossil Fuel DOWN 40.7%
On Dec. 21, 2012, I put $16 Million imaginary dollars in equal imaginary investments in 16 real energy companies; $8.0 in the Sustainable Energy space and $8.0 in the fossil fuel space. Excluding the value of dividends and transaction costs, but including the bankruptcy or crash of three companies in the sustainable energy space …
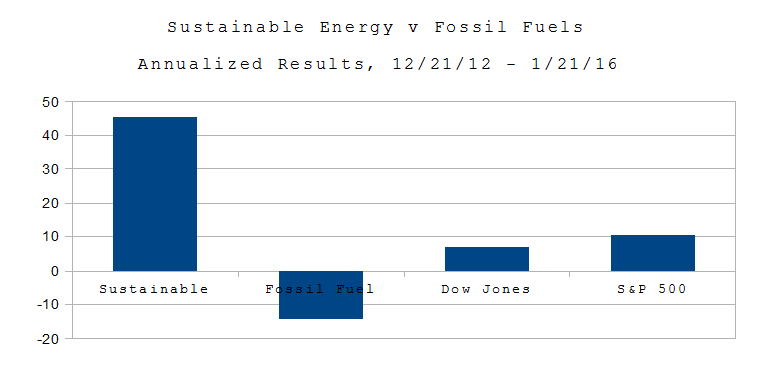
Energy Portfolios, 3 Years, 1 Month: Sustainable Energy Up 135.6, Fossil Fuel DOWN 42.8%
Wall St. 1/21/16. On Dec. 21, 2012, I put $16 Million imaginary dollars in equal imaginary investments in 16 real energy companies; $8.0 in the Sustainable Energy space and $8.0 in the fossil fuel space.
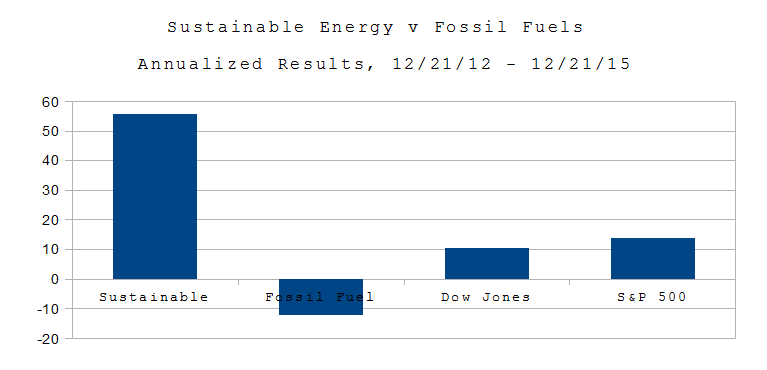
Today it is worth an imaginary $23.48 Million because while the Fossil Fuel portfolio dropped 42.8% of it’s total value, the Sustainable Energy portfolio increased 135.6%.
This excludes the value of dividends and transaction costs, but includes the bankruptcy or crash of three companies in the sustainable energy space.
This month’s post was delayed due to preparations for and digging out from Blizzard Jonas.
Industrialization in China: Side Effects can Kill
副作用可以杀死 Fùzuòyòng kěyǐ shā sǐ Side Effects Can Kill
China, since 1947, has become an economic powerhouse. But back in 2007, National Geographic reported, here, on a World Health Organization, WHO, report, that 656,000 people died in China in 2006 from air pollution. National Geographic also reported that polluted drinking water killed at the rate of 95,000 people per year in China in 2006. In 2012, The Guardian reported, here, that in 2010, 1.2 million people died in China and North Korea from air pollution.
Side Effects can kill. 副作用可以杀死 Fùzuòyòng kěyǐ shā sǐ
Energy Portfolios, 3 Years: Sustainable Energy Up 166.6%, Fossil Fuel DOWN 36.23%
On Dec. 21, 2012, I put $16 Million imaginary dollars in equal imaginary investments in 16 real energy companies; $8.0 in the Sustainable Energy space and $8.0 in the fossil fuel space. Excluding the value of dividends and transaction costs, but including the bankruptcy or crash of three companies in the sustainable energy space.
As of the close of trading on December 21, 2015:
- The Fossil Fuel portfolio was worth $5.1 Million, down 36.23% overall, down 12.08% on an annualized basis.
- The Sustainable Energy portfolio was worth $21.33 Million, up 166.6%, overall and 55.53% on an annualized basis.
- The Dow Jones Industrial Average is up 31.8% overall and 10.6% on an annualized basis, from 13,091 on 12/21/12 to close at 17,252 on 10/21/15.
- The S&P 500 is up 41.33% overall and 13.78% on an annualized basis, from 1,430 on 12/21/12 to close at 2,021 on 10/21/15.
- If there’s a war on coal, it’s part of the war on fossil fuel – and fossil fuel is losing.