On Dec. 21, 2012, I began an experiment in “Sustainable Capitalism” or “Sustainable Finance.” I put $16 Million imaginary dollars in equal imaginary investments in 16 energy companies, $8.0 Million in $1.0 Million investments in eight “Sustainable” energy companies, the other $8.0 Million in $1.0 Million chunks in fossil fuel companies.
As of the close of trading 54 months later,
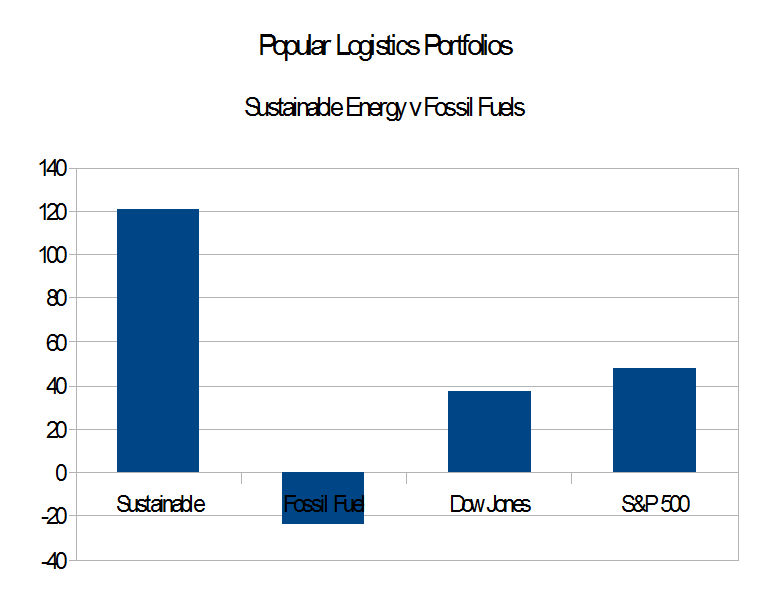
- The Market Capitalization of the sustainable energy companies is up 140.6%, from $39.58 Billion to $95.1 Billion. (See Table 6, below).
- The Market Capitalization of the Fossil Fuel portfolio is DOWN 10.38%, from $1.09 Trillion to $976.13 Billion. (See Tables 7 & 8, below).
This excludes the value of dividends and transaction costs, but including the bankruptcy or crash of three companies in the sustainable energy space …
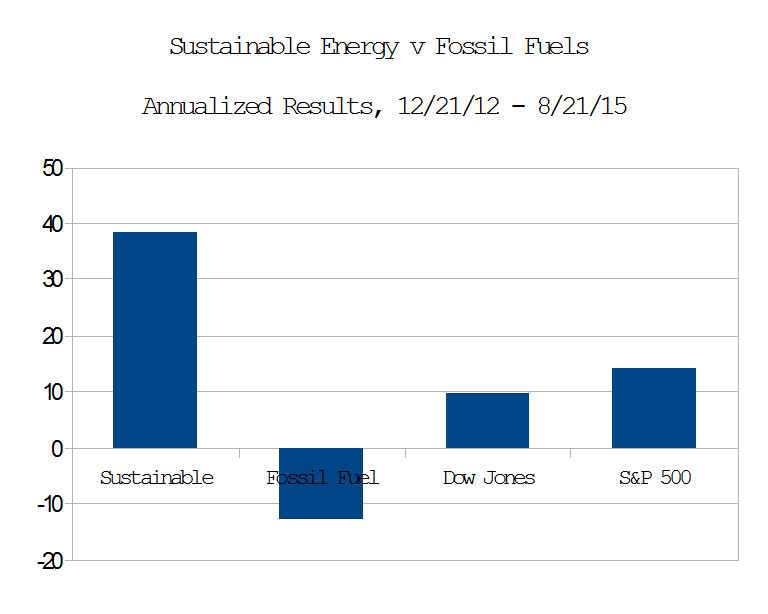
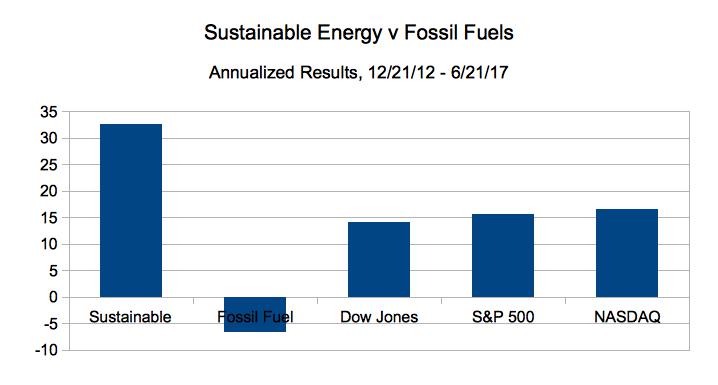
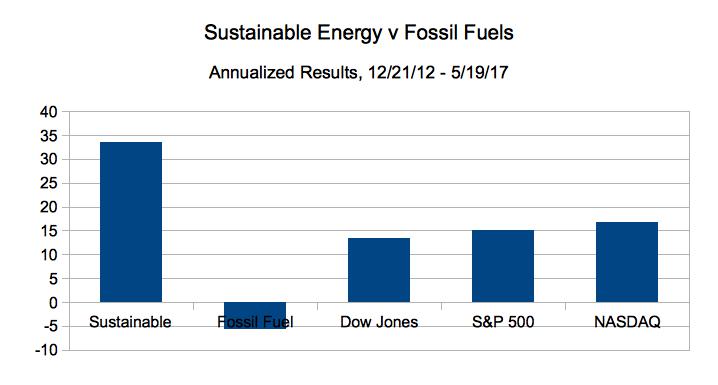
As of the close of trading on June 21, 2017:
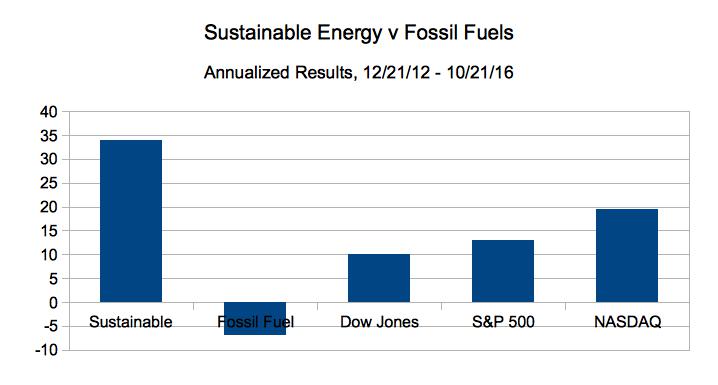
- The Fossil Fuel portfolio went from $8.0 Million to $5.617 Million, down 29.8% overall, down 6.62% on an annualized basis.
- The Sustainable Energy portfolio went from $8 Million to $19.75 Million, up 146.8%, overall and 32.6% on an annualized basis.
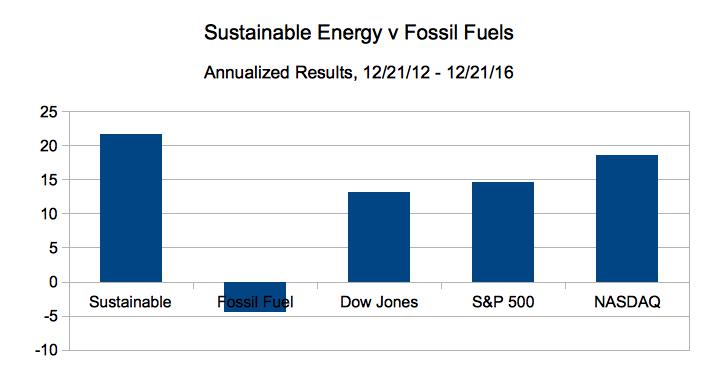
- The Dow Jones Industrial Average is up 63.55% overall and 14.12% on an annualized basis; from 13,091 on 12/21/12 to 21,410 on 6/21/17.
- The S&P 500 is up 70.35% overall and 15.6% on an annualized basis, from 1,430 on 12/21/12 to close at 2,436 on 6/21/17.
Continue reading →
 On Dec. 21, 2012, I put $16 Million imaginary dollars in equal imaginary investments in 16 real energy companies; $8.0 in the Sustainable Energy space and $8.0 in the fossil fuel space. Excluding the value of dividends and transaction costs, but including the bankruptcy or crash of three companies in the sustainable energy space, and one company in the fossil fuel space.
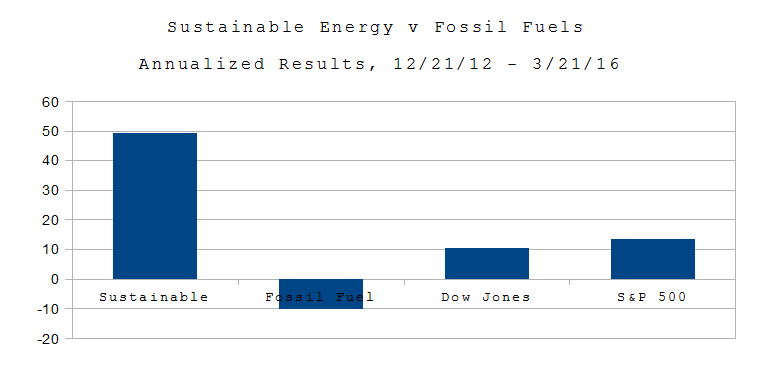
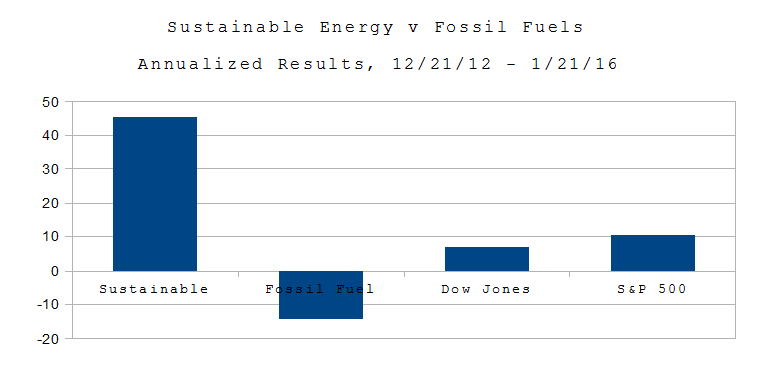 Wall St. 1/21/16. On Dec. 21, 2012, I put $16 Million imaginary dollars in equal imaginary investments in 16 real energy companies; $8.0 in the Sustainable Energy space and $8.0 in the fossil fuel space.
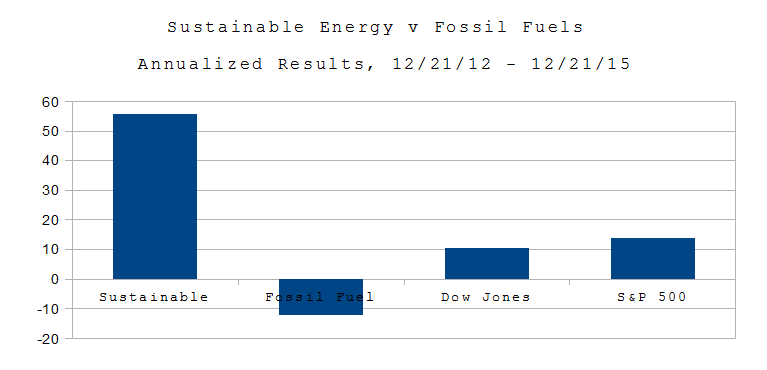 On Dec. 21, 2012, I put $16 Million imaginary dollars in equal imaginary investments in 16 real energy companies; $8.0 in the Sustainable Energy space and $8.0 in the fossil fuel space. Excluding the value of dividends and transaction costs, but including the bankruptcy or crash of three companies in the sustainable energy space.