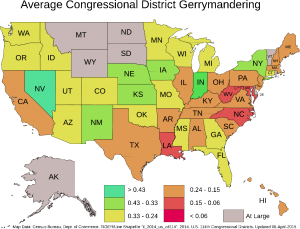
In our last post, we wrote about how to compute the Gerrymander Index of shapes, including Congressional districts. Since then we’ve fetched the U. S. Census Bureau tl_2014_us_cd114 Esri shapefile data set of the 435 Congressional Districts for the current 114th Congress, which includes the nine non-voting districts that send delegates to Congress. If you are terminally curious, download the comma-separated value text file of our results, based on Census Bureau dataset. We’re not going to discuss all 444 maps; restricting our attention to the best and the worst, the state of gerrymandering in these United States, and how the States of California and Texas are gerrymandering these days.
Of the four hundred forty four records in tl_2014_us_cd114, the most gerrymandered district is North Carolina Congressional District 12, with a Gerrymander Index of 0.0291, this based on its cartographic boundary as defined in the Census Bureau shape file.

