Category Archives: Infrastructure

Roller Coasters, Solar Power, Wind Power or Terrorist Tunnels

Qatari Emir w Ismail Haniya, Oct. 2012

Qatari Emir Hamad al-Thani with Ismail Haniya, Oct. 2012, Photo NY Times.

In October, 2012, Sheik Hamad bin Khalifa al-Thani, the Emir of Qatar, as reported in the NY Times, here, “pledged $400 million to build two housing complexes, rehabilitate three main roads and create a prosthetic center, among other projects” in Gaza.

The $400 Million could have built 133 MW of offshore wind or 100 MW of PV Solar electricity generation capacity.

Continue reading

Virtualization: 20% Lower Cost to Build; 70% Lower Costs for Power, Cooling & Operations

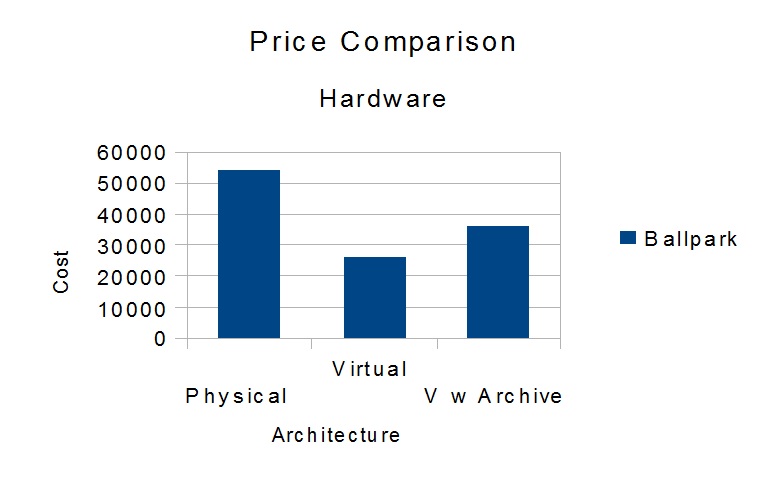
Virtualization, based on Table 0

Imagine an small to mid-sized enterprise which needs accounting, document management, e-mail,  a central file repository, centralized printer management, and a central anti-virus console. These services can be put on discrete servers, along with, using Microsoft’s authentication model, a redundant pair of machines described as “Domain Controllers.” Add an “Intranet” and a central backup system and you’re looking at 10 servers, at a cost, as shown in Table 1, below, in the neighborhood of $54,000.

The advantage of discrete servers for discrete functions is that maintenance on one system does not effect any others. By wrapping the logical functions – accounting, e-mail, etc – into “virtual machines” we get the same advantages – maintenance and upgrades to one system do not effect other systems – while reducing the total number of physical machines.

This can be “Virtualized” onto two or three servers at a cost, as shown in Table 2, below, in the neighborhood of $26,000 to $36,000. These are summarized in table 0, below.

Price Comparison
Item Ballpark
Physical $54,000.00
Virtual $26,000.00
V w Archive $36,000.00
Table 0

This savings also scales. Larger enterprises, which require more servers, may realize a 10 to 1 server consolidation.

Continue reading

The Celestial Shooting Gallery, Part Four: “You Have Nothing to Worry About (click) Worry About (click) Worry About (click)…”

Stability Model of an experimental distribution grid

A stability map of a simple power grid. Each point on this image represents an operating state of a simple power grid consisting of a few generators. Bluish regions constitute stable working states, red unstable and ‘salt-and-pepper’ represent chaotic behavior. One can tune a grid for stability by controlling the phasing of generators and transformers on the grid and such settings suffice for day-to-day operations. It is difficult to decide where, or by how much, abnormalities such as geomagnetic storms might push a system into red, unstable regions, or, worse, salt-and-pepper regions where the system oscillates between states. It is easy to find cases on the map where chaotic regions lie very close to stable regions, indicating that the destabilizing push need not be large at all. James Thorp, Cornell University, published in IEEE Spectrum

People paid to worry about the North American power grid regard geomagnetic storms as “high impact, low-frequency” events, spawning the inevitable acronym: HILF. Low frequency, in that a geomagnetic storm as intense as May 1921, at 5,000 nano-Teslas/minute, or the 1859 Carrington Event, best guess: 7,500 nano-Teslas/minute, might not happen in our lifetimes, the lifetimes of our children, or even our grand children. If signature traces in Arctic ice core samples are correct, these are ‘500 year events.’ When it comes to deciding where to put that preventative maintenance dollar, storm-proofing Oklahoma elementary schools against EF 5 tornadoes seems a far more practical spend than the hardening of electrical grids against a half-theoretical event that might not even happen in 500 years.

What pulls planners up short is the high impact part: the utter god-awfulness of a power grid that crashes and which then can’t boot itself up. There is a self-referential dependency: fixing a dysfunctional power grid requires it to be functional, as key aspects of the manufacturing of transformers need electricity.

Nor can one expect the cavalry to ride in anytime soon, as the vast geographic reach of geomagnetic storms means that one strong enough to take down the North American grid may very likely take down Eurasian grids as well – entire hemispheres could wind up in the toilet, and we only have two hemispheres. That and the statistical variableness to it all: the Carrington 1859 and May 1921 storms, nominally two ‘500 year events’ were, in fact, separated by only sixty-two years.

Where does the buck stop? Continue reading

Celestial Shooting Gallery, Part Three: When a CME Hits the Atmosphere

Failed GSU transformer at Salem River, NJ

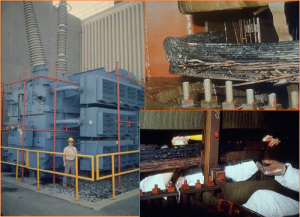
A Generator Step Up (GSU) transformer failed at the Salem River Nuclear Plant during the March 1989 geomagnetic storm. The unit is depicted on the left; some of the burned 22kV primary windings are shown on the right. Though immersed in cooling oil, the windings became hot enough to melt copper, at about 2000 degrees F. John Kappenman, Metatech

Coronal Mass Ejections are mainly charged particles, protons and electrons. When a CME arrives at Earth, the charged protons and electrons come under the influence of the Earth’s own magnetic field, the magnetosphere. Charged particles spin around the lines of magnetic force that comprise the magnetosphere, which diverts most of CME harmlessly around the planet, keeping Earth’s surface tranquil.

If the ejection is large enough, however, it can distort the shape of the magnetosphere, occasionally causing magnetic flux lines to snap and reconnect. When this happens, charged particles leak in and follow the magnetosphere’s flux lines down to the Earth’s ionosphere. There, they strike oxygen and nitrogen molecules and strip them of electrons. These ionized gases glow, giving rise to the ethereal beauty of the auroras around the north and south poles. Unfortunately, these excess charged particles also produce immense electrojets.

Continue reading

Celestial Shooting Gallery, Part Two: The Physics of Geomagnetic Storms

goddard_cme_earth

On August 31, 2012 a long filament of solar material that had been hovering in the sun’s atmosphere, the corona, erupted out into space at 4:36 p.m. EDT. The coronal mass ejection, or CME, traveled at over 900 miles per second. The CME did not travel directly toward Earth, but did connect with Earth’s magnetic environment, or magnetosphere, causing aurora to appear on the night of Monday, September 3. The image above includes an image of Earth to show the size of the CME compared to the size of Earth. NASA Goddard Spaceflight Center

Thursday, May 2nd, 2013, a coronal mass ejection (CME) hurled nearly one billion tons of charged particles from the sun’s corona at an outward velocity of one million miles per hour – 270 miles per second.

In less than a half hour, 2,700 virtual Empire State Buildings, 340,000 tons apiece – give or take a few gorillas – erupted from an active region of the Sun’s surface called AR1748, a northern latitude sunspot. AR1748 had just become visible on the western limb of the Sun’s surface when it ejected this mass, so the vast bulk of it hurled outward, not toward us in Libra, but more or less toward Cancer, at right-angles to us. In practical terms, it shot wide of its mark. Still an impressive shot. The CME had been triggered by an M class solar flare, the second largest in a five step scheme (An, Bn, Cn, Mn, Xn; for n a relative magnitude). It had been the largest coronal mass ejection observed thus far in 2013.

And it was still early in the day for AR1748.

Continue reading

Celestial Shooting Gallery, Part One: The Day We Lost Quebec

Electrojets over N. America

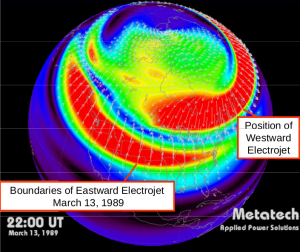
John Kappenman reconstructed the electrojets which formed in the ionosphere late in the March 13, 1989 geomagnetic storm which compromised the Hydro-Quebec power grid in Canada. Concurrently, the eastward jet induced ground currents that severely strained the electrical distribution grid of northern continental United States, resulting in a transformer failure at the Salem Nuclear Power Plant, in New Jersey. Courtesy of Metatech

Nearly a quarter century ago, on March 13, 1989,  a geomagnetic storm led to the collapse of the Hydro-Quebec electrical grid system, which furnishes power to much of the province of Quebec, Canada. So pervasive were abnormal currents, that protective circuit breakers tripped throughout the system, bringing the entire grid to a halt in about one and a half minutes. The grid’s self-protective systems were geared toward local abnormalities happening in particular places. In contrast, ground induced currents created abnormalities everywhere. The good news was that most of the hardware protected itself. The bad news was that six million customers were without power for as long as nine hours, and where transformer damage did occur, outages continued for another week.

Further south, the United States experienced a close shave. A second surge in the March 13 storm generated similar ground induced currents in the northern United States, with large current spikes observed from the Pacific Northwest to the mid-Atlantic states, one spike destroying a large GSU transformer at the Salem Nuclear Power Plant in New Jersey. According to John Kappenman, of the Metatech Corporation “It was probably at this time that we came uncomfortably close to triggering a blackout that could have literally extended clear across the country.”

Continue reading

The limits of network security: tension between convenience and safety

Map of Queensland, Australia

Map of Queensland, Australia


Long ago, 2000, and far away, in Australia, a malevolent hacker targeted the sewerage system. Courtesy of the site AssembleIt.Net, excerpted from Australia’s Hacked History

In April 2000 a man, Vitek Boden was arrested and charged with offences relating to the unlawful entry into Maroochy Shire Council’s sewerage system and environmental damage. His attack via wireless technology altered electronic data that led to malfunctions of the sewerage system. This caused a clean up cost of $13,110 and untold damage to the environment. The Crown’s case against Boden relied heavily on circumstantial evidence which exposed several areas for criticism for the defendant.

Continue reading

Why Invest in Infrastructure?

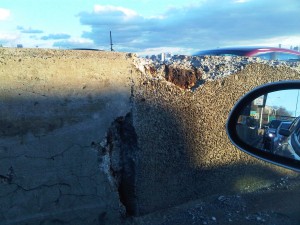
If you don’t invest in infrastructure, it fails. Remember New Orleans and Katrina? These pictures were not taken in New Orleans, Baghdad, Iraq, Falujah, Iraq,  Hama, Syria or Afghanistan.

Entrance to Lincoln Tunnel

Image Copyright (C) L. Furman, 2011. Used with Permission

They were not taken in Gaza,  Sudan, recently, Sarajevo in the 1990s, or Dresden, London Hiroshima, or Nagasaki, after WW II.

Entrance to the Lincoln Tunnel, 2

Copyright (C) 2011, L. J. Furman, All Rights Reserved

They were taken in New Jersey on the entrance to the Lincoln Tunnel on Nov. 23, 2011.

Senator Kerry: “We need to invest in our infrastructure.”

Senator John Kerry

Senator John Kerry

I met Senator John Kerry at the Harvey Nash Inc. Leadership Breakfast at the Plaza Hotel in NYC on Friday, March 2, 2012. He spoke unequivocally about infrastructure, energy, mass transit, and foreign policy, saying,

We need to invest in our infrastructure. The people who talk the loudest about ‘American Exceptionalism’ are destroying America.

Sending our children to college is competitiveness, not elistism.

“The American Infrastructure Financing Authority,” Kerry said, “would generate revenue by loaning money to people to build infrastructure. It has bi-partisan support. It should be a slam-dunk. But we can’t get it passed because of Republicans intransigence. The American people have to force the Republicans to compromise and force the Democrats to stand tall.

In the ’70’s we were #1 in college graduates; now we’re 16 th. We were #1 of the G 20, now we’re 5th.

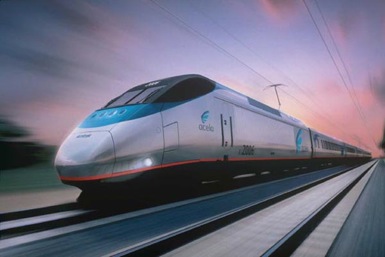
The Acela can go 150 mph – and it does for about 18 miles between New York City and Washington, DC. It can’t go 150 mph over the Chesapeake Bay bridge because in doing so it may wind up in the Chesapeake. It can’t go 150 mph in the Baltimore tunnel because the vibrations may damage the tunnel.
Acela

The Acela

Editor’s note: The Acela runs it’s top rated speed for 16 miles on a 220 mile trip – about 7.3%. The trip on regular Amtrak is 4 hours. The trip on Acela is 3 1/2 hours. That’s about 62.9 mph.If the tracks would allow the train to make the run at it’s design speed of 15o miles per hour the trip would take an hour and a half, not 3 1/2 hours. Average 125 mph, it would take about an hour and 45 minutes.

Image of wall of Bridge to the Holland Tunnel

A few years ago we were first in manufacturing solar energy. Now China has taken over that industry.

China spends 9% of GDP on infrastructure. Germany spends 5%. We spend less than 2%.

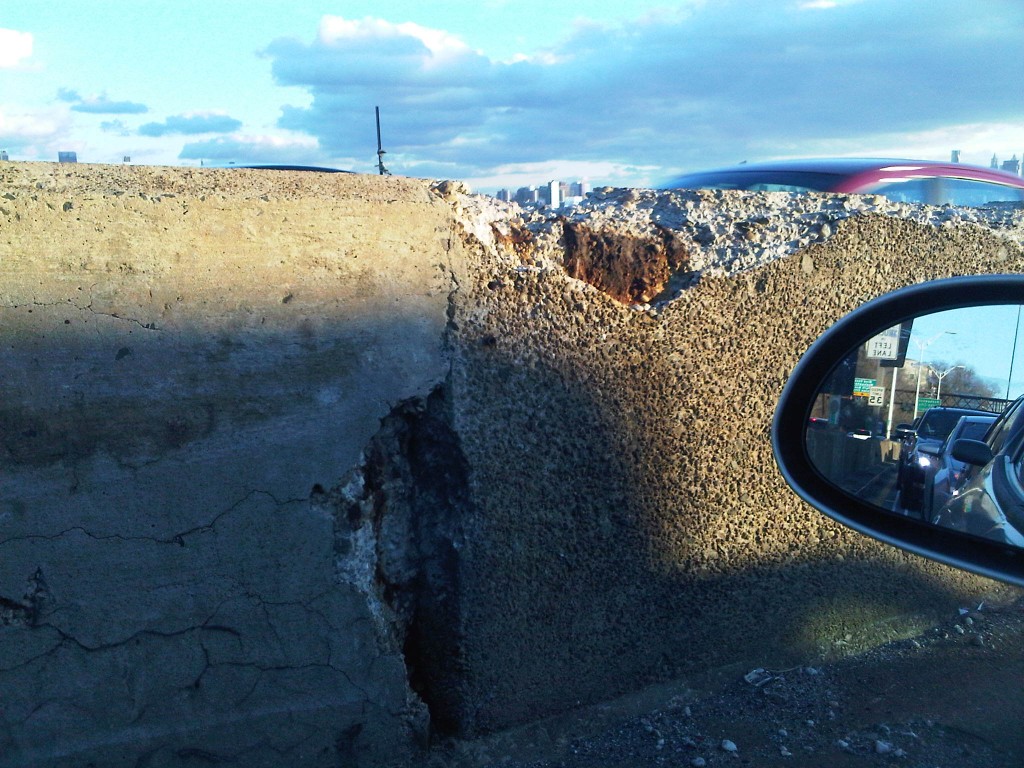
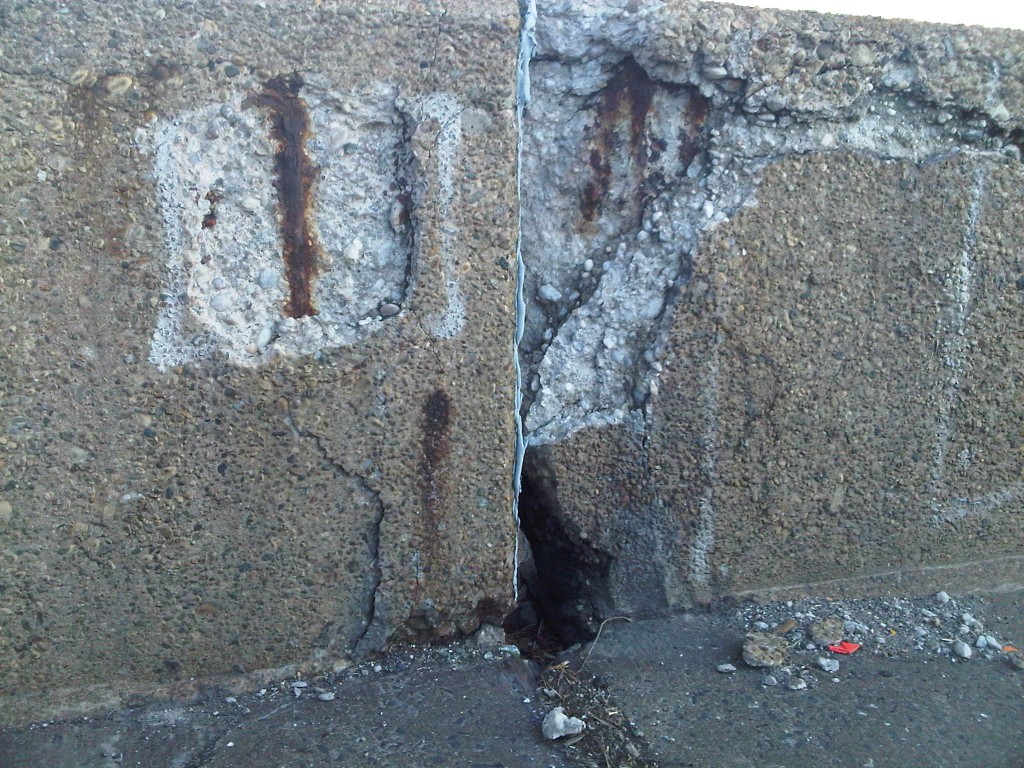
We are using the infrastructure that our parents and grandparents built. And it’s crumbling!
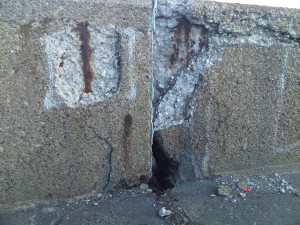
Wall of the bridge leading to the Holland Tunnel

Wall of the bridge leading to the Holland Tunnel

In order to compete we must rebuild our infrastructure – and send our children to school.  (And sending your children to school is not elitist.)

Kerry spoke like a Keynesian:

Saving GM and Chrysler saved about 1 million jobs. Had they been allowed to fail Ford and all the suppliers, and all the clothing stores, food stores, delis, diners, restaurants – all would have failed. Saving the American auto industry saved the midwest from a Depression. That’s not socialism; that’s what government is for. And Ford, GM, and Chrysler are profitable!

Editor’s note: Ford did not take TARP money. GM, Ford and Chrysler are building cars people want to buy, and people are buying them.  The following chart shows market capitalization, stock price, earnings per share, price earnings ratio and net profit margin for GM and Ford. Chrysler is not included because it is privately held.

Company Valuation Stock Price EPS P/E Ratio Net Profit
(Billions) (3/2/12) Margin
Ford $48.4 $12.72 $5.01 2.54 14.84
General Motors $41.4 $26.45 $4.58 5.77 4.06

According to San Francisco Chronicle / Bloomberg, here,

U.S. auto sales accelerated to the fastest pace in four years …  a 15.1 million seasonally adjusted annual rate, exceeding the 14.2 million pace that was the average of 17 analysts’ estimates… the best since February 2008 when U.S. sales ran at a 15.5 million rate,

GM deliveries rose 1.1 percent to 209,306 cars and light trucks, beating analysts’ estimates for a 4.8 percent decrease. Chrysler sales increased 40 percent to 133,521 and Ford Motor Co.’s climbed 14 percent to 178,644. Toyota Motor Corp. and Honda Motor Co. deliveries each gained 12 percent, while Nissan Motor Co. sales rose 16 percent.

Yet Romney, Santorum, Gingrich and Paul persist in the lunacy that bailing out GM and Chrysler was a mistake.  If they don’t want to govern, why do they want to be President?

Kerry also said:

Successful businesses today have a lot of cash. But the executives are reluctant to invest because the economic climate is too uncertain. That’s why government must step in.

This statement could have been made in 1932 by Franklin Delano Roosevelt or John Maynard Keynes.

Kerry criticized Santorum. “Saying my grandfather was a coal miner, so I could go to college, go to grad school, get an MBA and a JD, then get elected to the Senate, then make millions lobbying, and tell you not to send your kids to college…” If that’s not elitism and demagoguery I don’t know what that is.

The current political climate in Washington is terrible, that’s why Olympia Snowe is leaving the Senate. The Republicans are intransigent, they refuse to compromise; they are focused on destroying Obama’s Presidency – and will sacrifice America to do it. When G W Bush was President it took 30 days to get a judge approved. Today it takes 100 days, maybe 200 days. There were two (2) filibusters in the 19th Century, and another two (2) in the 20th before WW II. Strom Thurmond’s filibuster of civil rights legislation, a few more in the 60’s. Today there are 100 filibusters per session.

And “do the math, folks, we can’t balance the budget on the backs of our poor and our seniors. We must raise revenues. The Bush tax cuts on the wealthiest 1% and 2% must end.”

Kerry spoke about money in politics, and the disaster that was the Citizens United decision.

He also noted that Congress has an approval rating of 8%. I know why. Or at least, why I have disgust and contempt for most of the members of the House and Senate. The Republicans won’t compromise; they are beholden to “King” Grover, aka Norquist the Zeroth, and Democrats are too willing to compromise.

However, he ended on a positive note. He is confident that President Obama will be reelected, and is also confident that America’s best days are yet to come. All we have to is take the money out of politics, force the Congress to change, reelect the good incumbents and throw the bums out.

Question for John Kerry

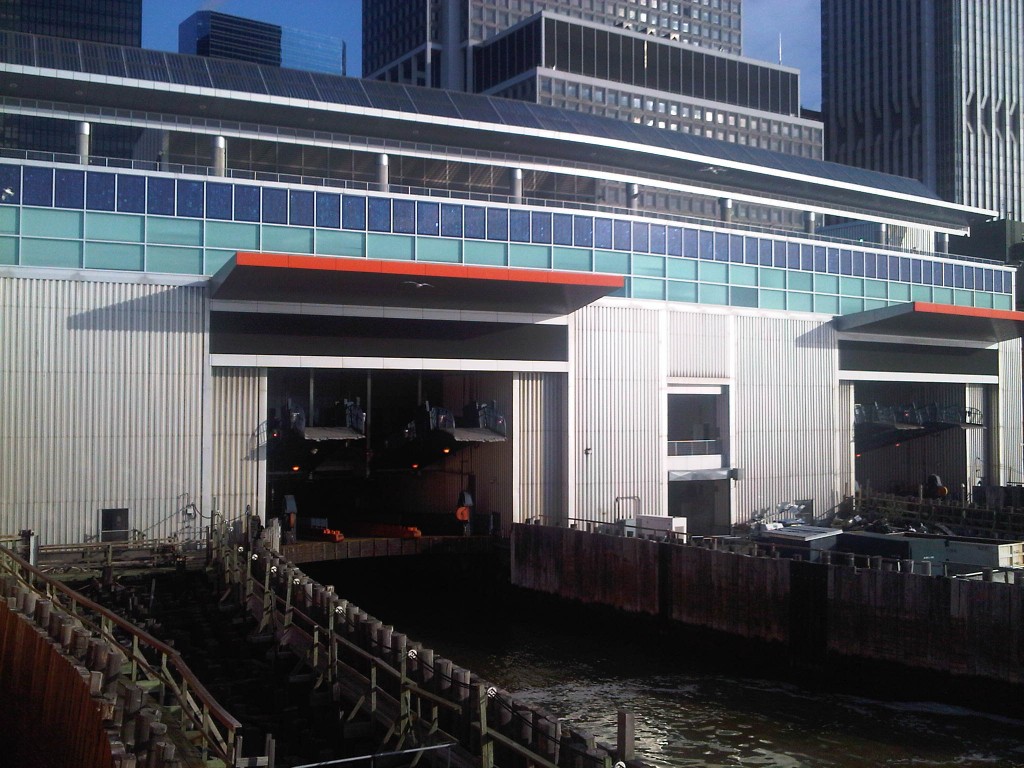
40 KW Solar array on Whilehall St Ferry Terminal

40 KW PV Solar Array on SI Ferry Terminal

While Chinese subsidies of their solar energy industry have decimated the manufacturing base of the American solar industry, solar energy continues to expand across the country.

What if we stimulated the solar industry with a public works program?

What if we decided to deploy a 40 kilowatt photovoltaic solar array on each of the approximately 90,000 public schools in the country?

The best kept secret in NYC may be found on the Staten Island Ferry, or more precisely, on the south roof of the Whitehall Street terminal. It’s a 40 kilowatt photovoltaic solar array.

Taxpayers pay the electric bills of the ferry terminal, which today are much lower because of the energy the system produces. Taxpayers also pay the electric bills of public schools, courts and other municipal, state and federal office buildings – and the externalized costs of pollution and “health effects” related to mining coal and uranium, drilling oil or frakking gas.

I met Senator John Kerry at the Harvey Nash Inc. Leadership Breakfast at the Plaza Hotel in NYC on Friday, March 2, 2012. At the conclusion I asked him to consider a 40 kw photovoltaic solar energy system on each of the approximately 90,000 public schools in the US.

At $5.00 per watt, which is less than the cost of new nuclear and much less than coal with carbon sequestration, these 90,000 systems would cost $18 billion. They would produce electricity without burning fuel, creating wastes, or creating targets for terrorists, and would pay for themselves in eight to 15 years, depending on the market price of electricity. They would also produce energy for 25 to 40 years – paying for themselves several times over.

This kind of a public works project would create jobs. Even if we didn’t mandate that these used products made in American factories, which I think we should, installation and maintenance would have to be local.

It would also lessen our dependence on fossil fuels.

And each solar energy powered building could be designed to generate electricity during the day during an emergency which shuts down the grid, further enhancing our emergency response capability.

Senator Kerry responded that this would be a perfect project for the Infrastructure Bank that he wants to create. However, the political climate is such that it can’t get done.

Urban Planning: A brief history of the Minneapolis skyways

Posted in its entirety from Jason Kottke’s blog. We did not know about this system, but think it’s worth considering for a number of reasons: it gets people walking in inclement weather rather than taking their vehicles or not travelling at all; probably stops the weather from entirely shutting down Minneapolis, and, to the extent it’s reducing vehicle and pedestrian traffic, likely reducing accidents, property damage, death and injury. An example of excellent urban transportation planning.

A brief history of the Minneapolis skyways

If you’ve ever been to downtown Minneapolis, you’ve likely used the large network of above-grade covered walkways that now stretches into nearly every corner of the downtown area. I’d always assumed they were built to help downtown workers and residents avoid cold weather during the winter, but that’s not the case.

Rather, the skyway system originally emerged from a twofold desire. First, planners in the 1940s and 50s were very concerned about managing increasingly dense pedestrian flows, and viewed skyways as a way to maximize the use of urban space for both people and automobiles (Byers 1998 154). Second, business owners were interested in maximizing their property values, and saw the skyways an opportunity to double the amount of valuable retail space in their downtown buildings (Byers 1998 159).

I used to work in downtown Minneapolis, and the skyways were great in the winter. To be able to take a walk and get lunch without having to bundle up in coat, hat, mittens, scarf, etc. was almost like living in a warm climate…and that’s no small thing during a long, dark Mpls winter. (via ?than)

via kottke.org – home of fine hypertext products.

We’re aware of the Chicago system of underground streets, the abandoned postal tube systems in the United States and others  (See, e.g. Multilevel streets in Chicago – Wikipedia, the free encyclopedia). To the extent we’ve failed to exploit these opportunities, or used and abandoned them, they constitute wasted assets. See also Minneapolis Skyway System (Wikipedia entry); Leif Petterson’s Take the Skyway on Vita.MN (The Twin Cities Going-Out Guide).

Decison on Keystone XL Pipeline Delayed Until After Presidential Election

Follow LJF97 on Twitter Tweet Via NPR‘s All Things Considered, from correspondent Richard Harris, Feds Delay Decision On Pipeline Project

The State Department is delaying a decision for at least a year on whether to approve the Keystone pipeline. The $7 billion pipeline would carry oil from the tar sands of Alberta, Canada, through the U.S. to Gulf of Mexico refineries. Nebraska’s state government and environmental groups have put intense pressure on the State Department and White House to reject the pipeline’s proposed route. NPR’s Richard Harris talks with Robert Siegel about the project.

Audio here (available after 1900 hours Eastern time, 10 November 2011).

Wikipedia’s entry Keystone XL Pipeline has a detailed – and, in our view, fair – account of the controversy.  While on balance we do not support the Keystone pipeline, a very well-reasoned argument in favor of the pipeline can be foundon the blog of JEH Land Clearing, from which we’ve taken the following map of the proposed pipeline (route in red; other pipelines indicated are already in existence/operation).

The Texas economy will benefit from the increase in production. The area east of I-35 is consistently in economic hardship (Port Arthur’s unemployment rate is hovering around 15%), and the construction, land clearing, surveying and refinery jobs will help lower the staggering unemployment rate. It is estimated that the Keystone Pipeline will help create over 20,000 jobs. Texas alone will see over $2.3B in new spending and the US will see about $20B in new spending. The increase of personal income in the state will be about $1.6B and the US will see an increase of $6.5BB. Profits will be re-invested in the local economy improving the quality of life and increasing the number of business in the area. Regardless of where you stand on this issue, one fact remains; the only one way to get heavy crude from Canada to the Texas gulf coast is a pipeline.

Excerpted from Oil Pipeline Invigorates Texas Economy

We support public works projects as economic stimulus, particularly those which come with improvements to energy and other infrastructure; in our view a massive wind/solar public works project in Texas might have the same effective economic stimulus with a better energy outcome, with a significantly lower environmental impact

What JEH doesn’t mention are the costs in terms of environmental damage, water, and health effects. These are long term costs, which are, in the parlance of neoclassical economics, “externalized,”or pushed into the future, and pushed off the balance sheets, kind of like CDO’s, or Collatoralized Debt Obligations, made famous by the financial crisis. Ecological economics recognizes that these costs must be considered, just as recent economic history forces us to recognize the real value of mortgages and mortgage backed securities. As we are learning, ignoring risk is unwise. Put bluntly, the Keystone XL pipeline is kind of like a $1.0 Million “McMansion” sold for $25,000 down, with a $1.0 Million mortgage which is, of course, a negatively amortized interest-only note for the first 5 years – at which time the borrowers will have to pay $1.1 Million, plus interest. But in reality, the $5 billion pipeline is like an aggregated set of five thousand negatively amortizing $1.0 Million toxic McMortgages on McMansions built of radioactive materials on toxic waste sites below sea level.

We intend to elaborate on the costs, risks, and benefits of pipelines in future posts; as well as a series on the Bonneville Power Administration, which has been supplying electricity in the Northwest for almost 75 years, and which we think is a model for energy-related public works projects.