Tag Archives: BioFuels

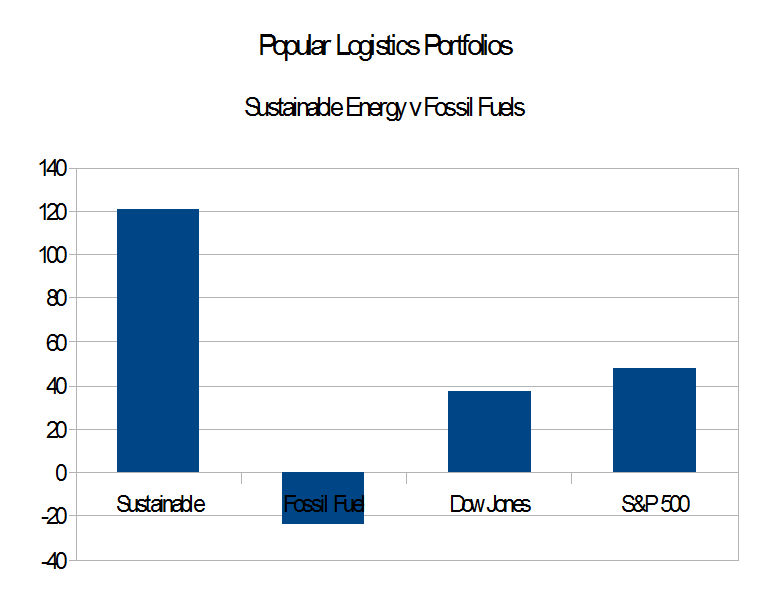
Energy Portfolios, 2 years 7 months Sustainable Energy Up 121%, Fossil Fuel DOWN 24%

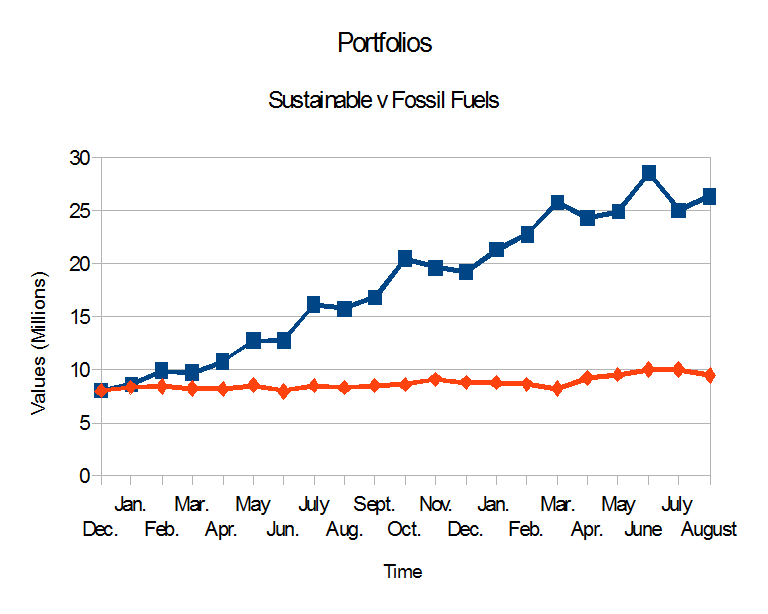
PLPort.1507On Dec. 21, 2012, I put $16 Million imaginary dollars in equal imaginary investments in 16 real energy companies; $8.0 in the Sustainable Energy space and $8.0 in the fossil fuel space. Excluding the value of dividends and transaction costs, but including the bankruptcy or crash of three companies in the sustainable energy space.

  • The Fossil Fuel portfolio is now worth $6.09 Million, down 23.93%.
  • The Sustainable Energy portfolio is now worth $17.64 Million, up 120.54%.
  • Both Fossil Fuel and Sustainable Energy are down slightly in the last month.
  • The Dow Jones Industrial Average is up 37.6%, from 13,091 on 12/21/12 to close at 18,016 on 7/21/15.
  • The S&P 500 is up 47.6%, from 1,430 to close at 2,110 on 7/21/15.
Continue reading

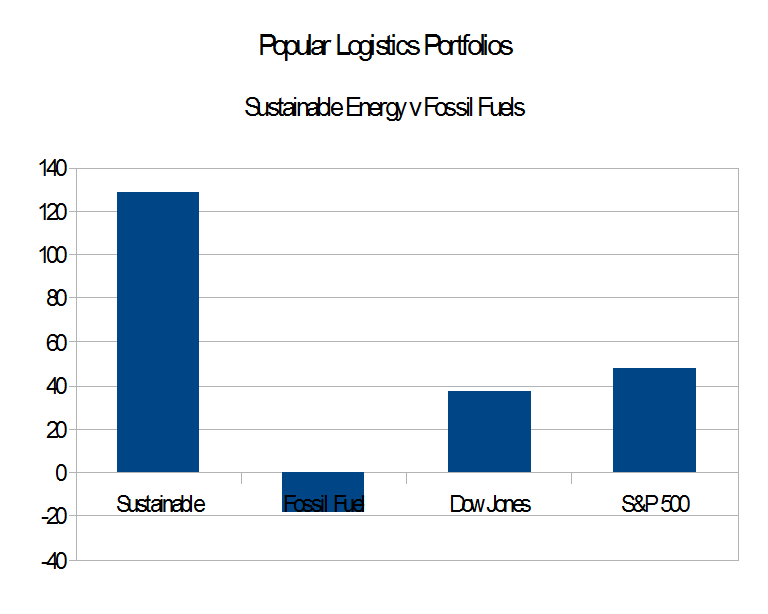
Energy Portfolios, 2 1/2 years Sustainable Energy Up 128%, Fossil Fuel DOWN 18.2%

PLPort.2015.6.21On Dec. 21, 2012, I put $16 Million imaginary dollars in equal imaginary investments in 16 real energy companies; $8.0 in the Sustainable Energy space and $8.0 in the fossil fuel space. Excluding the value of dividends and transaction costs, but including the bankruptcy or crash of three companies in the sustainable energy space,

  • The Fossil Fuel portfolio is now worth $6.54 Million, down 18.24%.
  • The Sustainable Energy portfolio is now worth $18.259 Million, up 128.24%.
  • The Dow Jones Industrial Average is up 37.6%, from 13,091 on 12/21/12 to 18,061 on 6/20/15.
  • The S&P 500 is up 47.55%, from 1,430 to 2,110.
  • The Energy Portfolios and the Indices are down in the last month.

Continue reading

Energy Portfolios, 2 years 5 Months: Sustainable Energy Up 137%, Fossil Fuel DOWN 13.7%

PLPort.1505On Dec. 21, 2012, I put $16 Million imaginary dollars in equal imaginary investments in 16 real energy companies; $8.0 in the Sustainable Energy space and $8.0 in the fossil fuel space. Excluding the value of dividends and transaction costs, but including the bankruptcy or crash of three companies in the sustainable energy space.

  • The Fossil Fuel portfolio is now worth $6.95 Million, down 13.1%.
  • The Sustainable Energy portfolio is now worth $18.98 Million, up 137.3%.
  • Both Fossil Fuel and Sustainable Energy are down slightly in the last month.
  • The Dow Jones Industrial Average is up 39.7%, from 13,091 on 12/21/12 to close at 18,286 on 5/21/15.
  • The S&P 500 is up 49%, from 1,430 to 2,131.

Continue reading

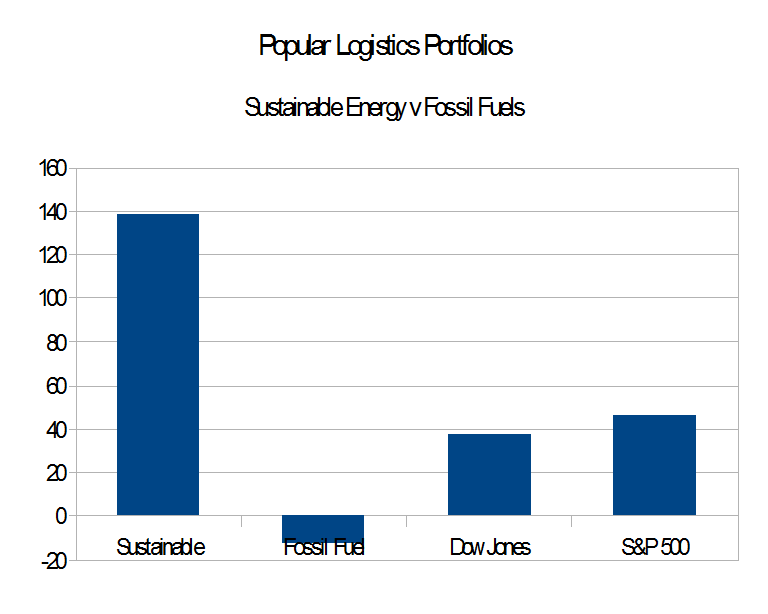
Energy Portfolios, 2 years 4 Months: Sustainable Energy up 138%, Fossil Fuel DOWN 12%

PLPort.2015.4.21

On Dec. 21, 2012, I put $16 Million imaginary dollars in equal imaginary investments in 16 real energy companies; $8.0 in the Sustainable Energy space and $8.0 in the fossil fuel space. Excluding the value of dividends and transaction costs, but including the bankruptcy or crash of three companies in the sustainable energy space,

  • The Fossil Fuel portfolio is now worth $7.0 Million, down 12.1%.
  • The Sustainable Energy portfolio is now worth $19.0 Million, up 138.1%.
  • The Dow Jones Industrial Average is up 37.1%, from 13,091 to 17,950.
  • The S&P 500 is up 46.6%, from 1,430 to 2,097.

The conclusion appears to be that sustainable energy is as good for the portfolio as it is for the planet.

Continue reading

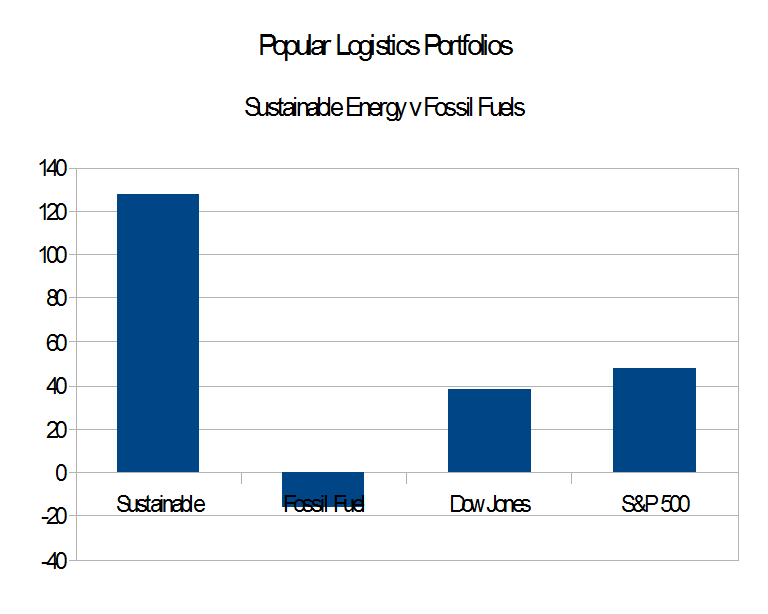
Energy Portfolios, 2 Years 3 Months: Sustainable Energy: UP 128%, Fossil Fuels: DOWN 16%

PLPort.2015.3.21

On Dec. 21, 2012, I put $16 Million imaginary dollars in equal imaginary investments in 16 real energy companies; $8.0 in the Sustainable Energy space and $8.0 in the Fossil Fuel space. The pattern, clear by March, 2013, is the Sustainable Energy Space is outperforming and the Fossil Fuel space is underperforming the indices.

Excluding the value of dividends and transaction costs,

  • The Fossil Fuel portfolio is now worth $6.7 Million, down 16.07%.
  • The Sustainable Energy portfolio is now worth $18.2 Million, up 127.62%.
  • The Dow Jones Industrial Average is up 38.47%, from 13,091 on 12/21/12 to 18,209 on 3/20/15
  • The S&P 500 is up 47.42%, from 1,430 to 2,108.

Continue reading

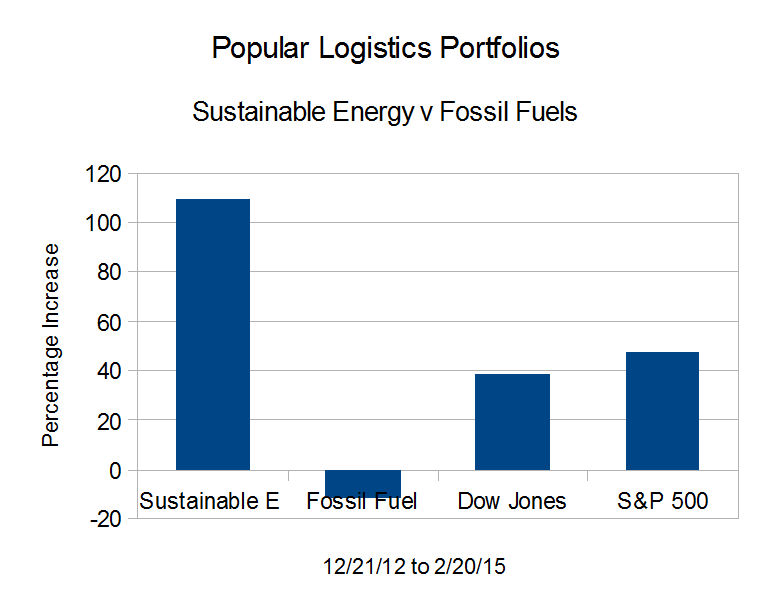
Energy Portfolios, 2 years 2 Months: Sustainable Energy up 109%, Fossil Fuel DOWN 11.8%

PopLogPort.150221
On Dec. 21, 2012, I put $16 Million imaginary dollars in equal imaginary investments in 16 real energy companies; $8.0 in the Sustainable Energy space and $8.0 in the fossil fuel space. Excluding the value of dividends and transaction costs,

  • Fossil Fuel portfolio: from $8.0 M to $7.06 Million, down 11.76%.
  • Sustainable Energy portfolio: from $8.0 M to $16.73 Million, up 109.18%.
  • Dow Jones Industrial Average: from 13,091 to 18,140, up 34.15 %,
  • The S&P 500: from 1,430 to 2,110,  up 42.10%.

Continue reading

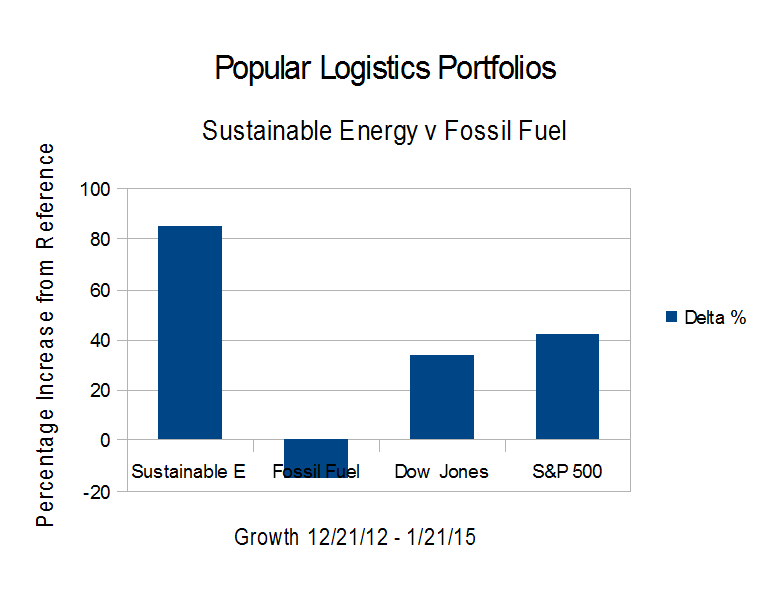
Energy Portfolios, 2 years 1 Month: Sustainable Energy up 85%, Fossil Fuel DOWN 14.6%

PLPort.2015.1.21

On Dec. 21, 2012, drying off from Hurricane Sandy, I put $16 Million imaginary dollars in equal imaginary investments in 16 real energy companies; Eight in the Sustainable Energy space and eight in the fossil fuel space.

  • The Dow Jones Industrial Average is up 34.15 % from 12/21/12 to 1/21/15
  • The S&P 500 is up 42.10%.
  • The Fossil Fuel Portfolio has dropped 14.55%.
  • The Sustainable Energy portfolio is up 85.09%.

Continue reading

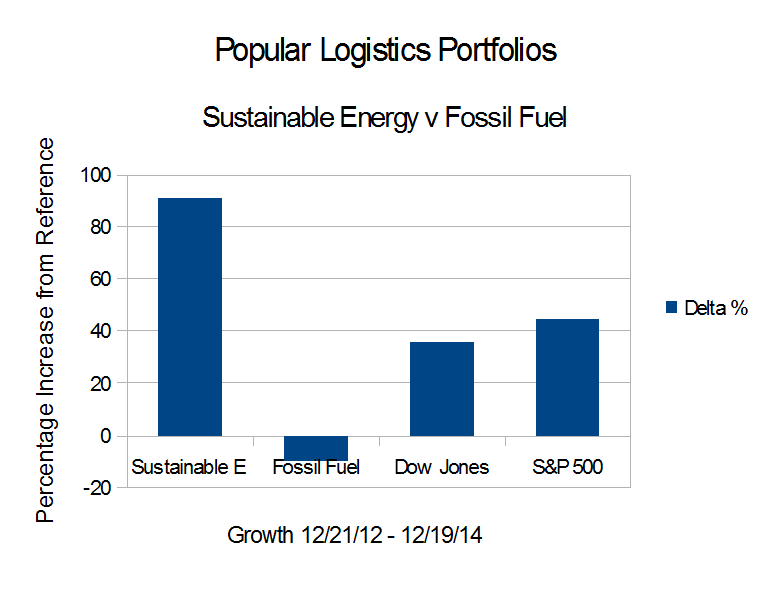
Energy Portfolios, 24 Months: Sustainable Energy up 91%, Fossil Fuel DOWN 10%

PLEP_M24On Dec. 21, 2012, I put $16 Million imaginary dollars in equal imaginary investments in 16 real energy companies; Eight in the Sustainable Energy spaces and eight in the fossil fuels spaces. The results:

  • The Dow Jones Industrial Average is up 36.2 % from 12/21/12 to 12/19/14.
  • The S&P 500 is up 44.8% from 12/21/12.
  • The Fossil Fuel Portfolio has dropped 10.00%.
  • The Sustainable Energy portfolio is up 91.34% from Dec. 21, 2012 but down from August, 2014.

Continue reading

Energy Portfolios, 23 Months: Sustainable Energy DOUBLED, Fossil Fuels DOWN (slightly)

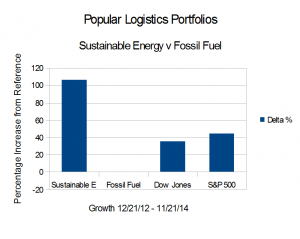
PLPort.2014.11.21On Dec. 21, 2012, I put $16 Million imaginary dollars in equal imaginary investments in 16 real energy companies; Eight in the Sustainable Energy space and eight in the fossil fuel space. At the close of trading, Nov. 21, 2014, that would be worth $24.3 Million and all of the increase is in the sustainable energy portfolio.

  • The Dow Jones Industrial Average is up 36.05 % from 12/21/12 to 11/21/14.
  • The S&P 500 is up 44.34% from 12/21/12.
  • The Fossil Fuel Portfolio has DROPPED 0.02%.
  • The Sustainable Energy portfolio is up 105.99% from Dec. 21, 2012 but down from August, 2014.

Continue reading

Energy Portfolios: 22 Months: Sustainable Energy Up But Dropping

PLPort.2014.10.21

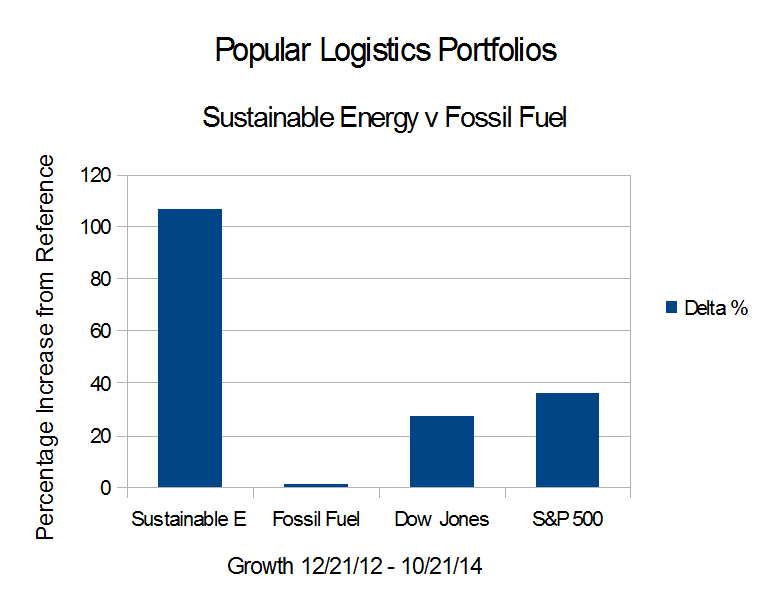
On Dec. 21, 2012, I put $16 Million imaginary dollars in equal imaginary investments in 16 real energy companies; Eight in the Sustainable Energy space and eight in the fossil fuel space. Between December 21, 2012 and October 21, 2014

By 10/15/14, GT Advanced Tech had filed for bankruptcy protection, and other stocks in the portfolio dropped to points near their Dec. 2012. The portfolio as a whole dropped 55% from Sept. 19, 2014. Stay tuned, and keep your seat belt on. Continue reading

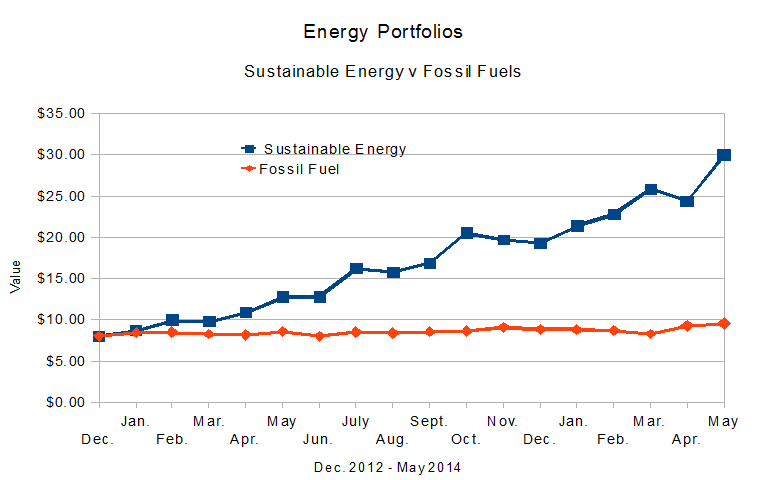
Energy Portfolios: 20 Months: Conclusions & Observations

PL_Port_1408Conclusions:

  1. The performance of most of the companies in these portfolios supports the hypothesis that a paradigm shift away from fossil fuels and toward renewable energy systems is underway.
  2. Investing in an index fund may have been more lucrative – and less stressful – than investing in the Fossil Fuel portfolio.
  3. Investing in paradigm shifting technology, i.e., First Solar, Sunpower, GT Advanced Technology and Vestas may be very lucrative.
  4. A diversified portfolio in paradigm shifting technology may also be effective. The “home runs” will more than make up for the “strike-outs.”
  5. Investing in a well-run, or well-connected, company, i.e., Haliburton, in a declining industry may also be lucrative.

Observations:

  1. The long term trend appears to be that investments in Sustainable Energy are likely to pay off in the long term and also, probably, the short term.
  2. Investments in Fossil Fuels, however do not appear likely to appreciate in the near future, even in a “Bull Market,” such as we appear to be in.  However, a speculator, i.e., a gambler, may be able to play various fossil fuel stocks, buying at lows and selling at highs. While I am not an investment professional, I personally, don’t know if this is worth the risk. I prefer to do my gambling in Atlantic City, New Jersey and Las Vegas, Nevada.
  3. When considered against the backdrop of global geopolitics, i.e., Russia, which exports oil and methane, invading Ukraine, ISIS in Iraq and Syria threatening to take over Iraqi oil operations, other turmoil in the Middle East, a paradigm shift away from fossil fuels seems likely to insulate energy flows from remote geopolitical events and strengthen economies that have executed this paradigm shift. Therefore, investments supporting such a paradigm shift may do well, while investments supporting the existing paradigm may not.

Continue reading

Energy Portfolios, 20 Months: Sustainable Energy up 229%, Fossil Fuel up 18.4%

PL_Port_1408On Dec. 21, 2012, I put $16 Million imaginary dollars in equal imaginary investments in 16 real energy companies; $8.0 iMil in the Sustainable Energy space and $8.0 iMil in the fossil fuel space.

  • The Dow Jones Industrial Average is up 30.16 % from 12/21/12.

  • The S&P 500 is up 39.3% from 12/21/12.

  • The Fossil Fuel Portfolio continues to dramatically underperform the reference indices. It is up 18.36% from Dec. 21, 2012 and down 5.67% from July, 2014.

  • The Sustainable Energy portfolio is up 229.19% from Dec. 21, 2012.

Continue reading

Energy Portfolios: 19 Months: Sustainable up 222%, Fossil Fuel up 25%

PLPortfolio.1407aOn Dec. 21, 2012, I put $16 Million imaginary dollars in equal imaginary investments in 16 real energy companies; Eight in the Sustainable Energy space and eight in the fossil fuel space. Here are the results since Dec. 21, 2012:

  • The Dow Jones Industrial Average is up 30.26%.
  • The S&P 500 is up 38.04%.
  • The Fossil Fuel Portfolio is continues to dramatically underperform the reference indices. It is up 25.08% from Dec. 21, 2012.
  • The Sustainable Energy portfolio is down 11% from last month, but is up 221.77% from Dec. 21, 2012.

The details are below.

Continue reading

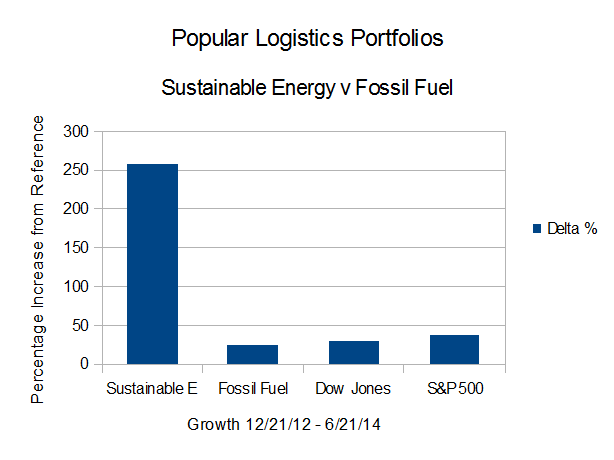
Energy Portfolios: 18 Months: Sustainable up 257.06%: Fossil Fuel up 24.56%

PL_EnergyPort_14_06On Dec. 21, 2012, I put $16 Million imaginary dollars in equal imaginary investments in 16 real energy companies; Eight in the Sustainable Energy space and eight in the fossil fuel space. In the 18 months between the close of trading December 21, 2012 and the close of trading June 20, 2014,

  • The Dow Jones Industrial Average is up 29.46% from 12/21/12.
  • The S&P 500 is up 37.27%.
  • The Fossil Fuel Portfolio is up 24.56% from Dec. 21, 2012.
  • The Sustainable Energy portfolio is up 257.06% from Dec. 21, 2012.

In addition to the data summary, below, this post, the 21st in the series, will be followed with a summary analysis.

Continue reading

Energy Portfolios: 17 Months: Sustainable up 211.6%: Fossil Fuel up 18.52%

EnergyPortfolios_1405aThe Dow Jones Industrial Average is up 26.29% from 12/21/12.
The S&P 500 is up 32.03%.
The Fossil Fuel Portfolio is up 18.52% from Dec. 21, 2012.
The Sustainable Energy Portfolio is up 211.6% from Dec. 21, 2012. Continue reading