Tag Archives: Microsoft

Announcing the Popular Logistics Virtual Portfolio in Information Technology

Hot on the heels of the December 21, 2012 launch of the Popular Logistics Virtual Portfolio in Sustainable Energy, here, up 22.36%, I am announcing the launch of the Popular Logistics Virtual Portfolio in Information Technology. Roughly $1.0 million in Apple, Google, HP, IBM, Intel, Microsoft, and Oracle.(Their investor relations pages are AppleGoogle, HPIBM, Intel, Microsoft, and Oracle.)


Tech Virtual Portfolio
Item Stock Price Shares Total
1 Apple $446 2,242 $1,000,000
2 Google $795 1,258 $1,000,000
3 HP $17 59,559 $1,000,000
4 IBM $198 5,051 $1,000,000
5 Intel $20 50,000 $1,000,000
6 Microsoft $27 37,037 $1,000,000
7 Oracle $24 41,667 $1,000,000
total $7,000,000
Table 1. Acquisitions, Start of Business, 2/22/13

Generally speaking, here’s what I expect:

  • Apple, IBM: I expect to significantly outperform the Dow Jones and S&P 500.
  • Google: I expect to perform in line with the Dow Jones and S&P.
  • HP: An investment in HP is speculative. Whitman may turn the company around. The stock might wildly outperform the Dow & the S&P. As Gerstner might say, however, it’s hard to teach an elephant to dance. The stock may plummet.
  • Intel, Oracle, I don’t know enough to have an expectation.
  • Microsoft may become a leading indicator of the economy.  Thus, if the S&P does well, Microsoft may do better.

These are in table 2, below

Continue reading

Apple at $665 per share – or $705 – or $1077

space-apple-logo

Apple, if it can be compared to Google, IBM, Intel, Microsoft, and Oracle, should be priced at 665 per share. This analysis is simply based on Stock Price, Earnings per Share (EPS) and the Price Earnings ratio. or P/E. The average P/E of these companies is 15.08. If Apple’s stock was 15.08 times earnings, it would be 665. If you take Apple out of the mix, the average P/E becomes 16.01. At 16.01 times earnings, Apple’s stock price would be 705. And if priced like Google, $1077. Continue reading

Apple: Worms Eating the Core or Golden?

Apple Logo

Apple stock closed on October 9, 2012 at $635. While up $247, or 64%,  for the year, the stock price has dropped 70 points, 10%, from the peak of $705 reached on Sept. 21, 2012. Where will it go next?  What caused this 10% drop? And what about Amazon, Google, Microsoft, & Research in Motion?

Here’s what I think:

  1. Apple (AAPL) will announce earnings on October 25, 2012. I expect $46.79 to $48.9 per share on an annualized basis, up 10 to 15% from the current $42.54 per share.
  2. Apple’s share price will increase back to $700, and then to $750 by year-end, 2012.
  3. Amazon (AMZN), Google (GOOG) and Microsoft (MSFT) will be stable thru to year-end, 2012.
  4. Research In Motion (RIMM) will be acquired by June 2013.

Continue reading

Facebook IPO: The Sound of Bubbles Popping

Soap Bubble

Soap Bubble, by Irfan Mirza

 Facebook went public on Friday, May 18, 2012. Trading for FB opened at $42.025 per share, giving the company a market capitalization of $72.76 Billion. However, Facebook closed it’s first day as a publicly traded stock down 9.3% at $38.105 per share. On it’s second day, Monday, May 21, it opened at $36.53 per share and closed at $34.03 per share, dropping another 6.8%, and 19% from the opening price. It’s sliding is raising eyebrows in the financial media (Business Week, Chicago Tribune, Reuters).

A Bubble Popping, by Richard Heeks

Bubble Pop, by Richard Heeks

But the question may be less “Why is Facebook’s stock price dropping?” or “Who’s to blame?” than “What should be it’s price?

GMO‘s Jeremy Grantham talks about “Reversion to the Mean.” The mean, however, for a stock with 2 days of history is not statistically meaningful. So I compared it to Apple, Google, IBM, Microsoft, and Oracle, pulling data off of the Internet at Finance.Google.Com after the close of trading on Monday, May 21, 2012.

(Image Links: Soap Bubble & Bubble Pop)

Continue reading

The World Will Not End & Other Predictions for 2012

space-apple-logo


Here are my top 10 predictions for 2012. These are less readings of the tea leaves or the entrails of goats and chickens and more simple extrapolations of patterns in progress. Altho that may be the way effective oracles. They just masked their observations with hocus pocus, mumbo-jumbo, and guts.

This list runs a gamut from business and technology to energy, instability in the Middle East, micro-economics in the United States, politics, and not-yet-pop culture.

  1.  Apple and IBM will continue to thrive. Microsoft will grow, slightly. Dell and HP will thrash. A share of Apple, which sold for $11 in December, 2001, and $380 in Dec. 2011, will sell for $480 in Dec. 2012.
  2. The Price of oil will be at $150 to $170 per barrel in Dec., 2012. The price of gasoline will hit $6.00 per gallon in NYC and California.
  3. There will be another two or three tragic accidents in China. 20,000 people will die.
  4. There will be a disaster at a nuclear power plant in India, Pakistan, Russia, China, or North Korea.
  5. Wal-Mart will stop growing. Credit Unions, insurance co-ops and Food co-ops, however, will grow 10% to 25%.
  6. The amount of wind and solar energy deployed in the United States will continue to dramatically increase.
  7. The government of Bashar Al Assad will fall.
  8. Foreclosures will continue in the United States.
  9. Arizona Sheriff Joe Arpaio will resign. Calls for Clarence Thomas to recuse himself from matters involving his wife’s clients will become louder, but Justice Thomas will ignore them. A prominent politician who says “Marriage is between a man and a woman,” or her husband, will be “outed” as gay. President Obama will be re-elected.
  10. The authors of Vapor Trails will not win a Nobel Prize for literature. They will not win a “MacArthur Genius Award.” Nor will I despite my work on this blog or “Sunbathing in Siberia” and the XBColdFingers project.

Here are the details … Continue reading

The Crash of 2011

US Capitol Follow LJF97 on Twitter  Tweet I thought the market would crash in the wake of the Earthquake / Tsunami / Nuclear Meltdowns at Fukushima. It didn’t. However, something much less serious may be bringing the market – and the economy – to it’s knees. Politics. The Voice of America reported here that Standard & Poors downgraded US debt from AAA to AA+. Click here for the S&P’s Special Report and here for the full report.

S&P’s analysts wrote:

The downgrade reflects our opinion that the fiscal consolidation plan that Congress and the Administration recently agreed to falls short of what, in our view, would be necessary to stabilize the government’s medium-term debt dynamics.

John BoehnerIt is clear that the emphasis on cutting government spending, eliminating government jobs, eliminating benefits to unemployed citizens, rather than raising revenues and developing infrastructure is not in the long term or short term interests of the United States. As the 512 point drop in the Dow Jones Average, and the downgrade of US debt indicate, Republicans and the Tea Party should be careful for what they wish for – they just might get it.

In the discussions over the debt ceiling, John Boehner said something to the effect that if a family or a business is borrowing too much it simply must tighten it’s belt. Continue reading

Apple v Microsoft, 2011.

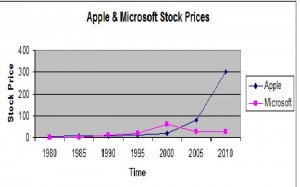
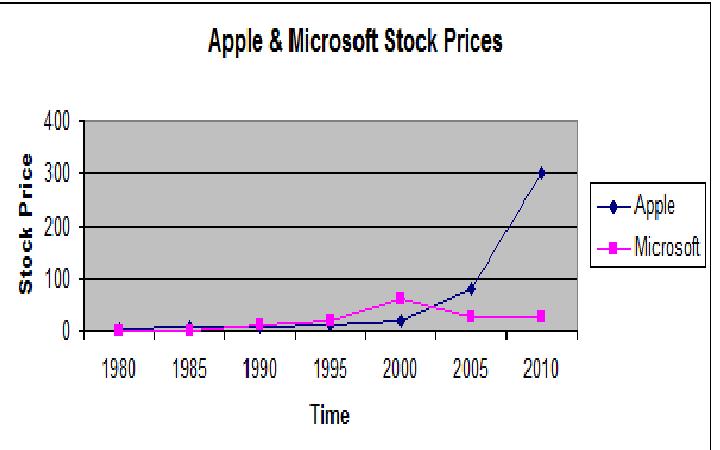
Graph of Apple and Microsoft, stock price, 1980 to 2010At a seminar on June 9, 2011, on securing the mobile worker, Apple‘s representative said  “We truly did not understand what we built.” That’s a direct quote. He went on to say “Here’s how they use it at GE, and Hyatt, and in the pharmaceutical industry.” A few minutes later he said “When users tell us what they can’t do, what they need to do, we listen, so tell us what you need.” At seminars on Microsoft‘s products, their consultants describe their software by saying “This is what we built, this is what it does, and here are our best practices – this is how you should use our software.”

This  is it. Apple’s “We truly did not understand what we built,” versus Microsoft’s “This is what we built, this is what it does, and here are our best practices – this is how you should use our software.” These statements define the corporate cultures.

Apple, at $325 per share, is a $300 billion company. With earnings of 21 per share, it has a price earnings  ratio of 15.8. It has no debt.  It is down slightly from it’s high of around $350 per share, reached a few weeks ago. There are 46,000 employees. Net income of 5.99 Billion on $24.67 Billion.  Microsoft, at $24 per share, is a $200 billion company. With earnings of $2.92 per share it has a P/E of 9.44. There are 89,000 employees, $16.4 billion revenue and $5.2 billion net income.

Microsoft’s income per dollar of revenue is higher – but they don’t make hardware. Revenue per employee at Microsoft is $184,000. Revenue per Employee at Apple is $536,000.  Income per Employee at Microsoft is $58,000. Income per Employee at Apple is $130,000.

These data are summarized below,

Employees Net Income Revenues Inc / Emp Rev / Emp
(Millions) (Millions)
Apple 46,000 $5,990 $24,670 $130,217 $536,304
Microsoft 89,000 $5,200 $16,400 $58,427 $184,270


When I last looked at Apple and Microsoft, October 30, 2010, here,  Apple was 305.24 per share, with an EPS, of $15.15 and a P/E of 20.147. It’s market capitalization was $279.59 Billion. Microsoft was $26.28, with an EPS of 2.11, P/E ratio of 12.48 and market capitalization of $227.42 Billion, $52 Billion less than that of Apple.  Today Apple’s market capitalization is up 25% to $300 billion and Microsoft’s market capitalization is down about 12% to $200 billion. Apple’s market capitalization is $100 billion higher than Microsoft’s.  Apple’s all time high stock price was a few weeks ago, and I expect it will bounce back and keep climbing as long as they keep selling hardware and software that shifts the paradigm. Microsoft’s was in 1999.  I don’t expect Microsoft to go out of business, but it’s days of shifting the paradigm and tremendous growth are gone.
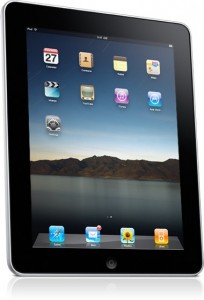
The iPad (Apple site, here) is a paradigm shifting device.  It has a dual core A5 processor, 16, 32, or 64 GB of flash memory, and no moving parts (other than electrons, which are hard to keep still).  Treated properly, it should last for 10 or 20 years.  It adds a layer of durability and obsolescence resistance to personal electronics.  It puts us on the road from “disposable” consumer electronics back to durable, sustainable consumer electronics  (click here).

And it’s selling by the millions. Apple has sold 200 million iOS devices – iPhones, iPads, iPods Touch, that’s one for two out of three Americans. It’s sold 25 Million iPads, 14 million in 2010 and 11 million in the first half of 2011. The sales projections from Wall Street are tremendous, (Florin at UnWired, Schonfeld at Tech CrunchElmer-DeWitt at Fortune). People buy multiple devices, e.g., iPhone and iPad or iPod Touch and iPad.  These are driving sales of music, apps – by the billions –  and the Mac. Microsoft is buying SKYPE, which is a great company with a great product but it doesn’t know how to make money. Apple is going up, both in terms of market capitalization and earnings. Microsoft is going nowhere.

Continue reading

Apple v Microsoft; On Strategy

Microsoft sells different flavors of soda. Apple sells water, coffee, tea, beer, wine, vodka, cheese, meats, breads, … and it also sells soda.”

Stock Price and Corporate Valuations

On Oct. 28, 2010, Apple closed at 305.24, about 4% below its the historic high of 319, reached on October 18, 2010. Apple’s earnings per share, EPS, is $15.15. It’s price earnings ratio, P/E, is 20.147. It’s market capitalization is $279.59 Billion.

That same day, Microsoft closed at $26.28, at 45% of it’s historic high of 57.625, reached on 12/17/1999. Microsoft’s EPS is 2.11, P/E ratio is 12.48, and market capitalization is $227.42 Billion, $52 Billion less than that of Apple.

If you look at a graph of their stock prices, Microsoft climbed spectacularly from 1986 to 1999, then plummeted and has been basically flat since it crashed in 2000. Apple climbed much more slowly, until recently, and may still be rising. However, while the graph may tell one thousand words, it doesn’t tell the whole story. And there are two flaws:

  1. The graph is an approximation of the stock price of AAPL and MSFT from the period of 1980 to 2010. It is neither complete, detailed, or rigorous. Complete details can be found on the Internet. The graph shows that Microsoft grew during the ‘80’s and ‘90’s then spiked dramatically and crashed around 2000. Actual high point was Dec. 17, 1999. The low of 21 reached on Dec. 29, 2000. Apple was doing pretty badly during the ‘90’s, however, since Steve Jobs return in the mid to late 90’s turned around. The stock price increased to 100 in 2007 or 2008 to 318 earlier this month.
  2. The graph doesn’t show the increase in market capitalization. An investment in Microsoft of about $3,000 at the IPO in March, ’86 would have been worth about $1.0 Million at the peak in Dec. ’99, and would still be worth about $455,000 today, an increase of 15,200%. Apple and Microsoft went from Million-Dollar companies in the early 1980s to companies worth $280 and $227 Billion, respectively today.

But perhaps the real insight is to view of these curves from a systems thinking perspective. Is the Microsoft stock price curve an example of overshoot and collapse? Will it recover or has it reached a steady state? Is Apple peaking? Is it about to collapse? Will it drop, and stabilize, like Microsoft, to a point less than half of it’s peak? And if so, if not now, when? Continue reading