 Earlier today one of my friends handed me a copy of some satire published in the New York Post, a tabloid in the tradition of the London rags, on the subject of “Climate-Gate.” At about the same time, Roger Saillant, co-author of Vapor Trails, who heads the Fowler Center for Sustainable Value at Case Western Reserve University pointed me to Elizabeth May’s post on the hacked computers and stolen e-mails at East Anglia University. Ms. May leads Canada’s Green Party.
Patrick Michaels, of the Competitive Enterprise Institute, which is really a public relations arm of Exxon Mobil, was once a scientist at the University of Virginia. He is famous for giving testimony attacking Dr. James Hansen to the U.S. Senate. However, when interviewed by Elizabeth May on Canada’s CBC Sunday Morning’s “Kyoto on Trial” in 2002, Michaels admitted to redrawing Hansen’s graph to make it wrong. Michaels, who has traded the scientific method for Stanislavsky’s acting method, admitted to perjury in his testimony before the United States Senate.
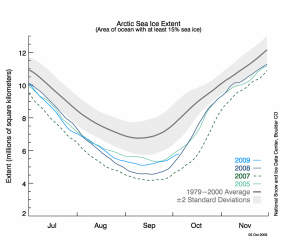
The graph shows the amount of sea ice from July thru November from 1979 to 2000, then in 2005, 7, 8, and July thru Sept., 2009. It is from the National Snow and Ice Data Center, Boulder Colorado (here) published Oct. 6, 2009. The dark gray line shows Arctic sea ice from 1979 to 2000. The gray band shows 2 standard deviations from the mean. The colorful lines show that Arctic sea ice is at or well below two standard deviations from the mean levels of 1979 to 2000. Clearly there is less ice in the Arctic then there used to be. Continue reading