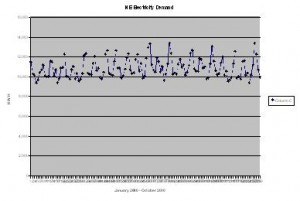
This curve, derived from the ISO New England electricity demand table, here, shows that electricity use has been rising steadily since January, 2000.
Three observations:
- There are two (2) annual peaks, one in July-August, and an unexpected peak in December-January.
- The peaks are getting higher.
- Low demand is flat and High demand is rising. The high of 13,386 gwh in July, 2010, is 43% above the low of 9,352 gwh, April, 2000.
I’m not sure what it means. Check back while I figure it out.
