Yearly Archives: 2015

Energy Portfolios, 3 Years: Sustainable Energy Up 166.6%, Fossil Fuel DOWN 36.23%

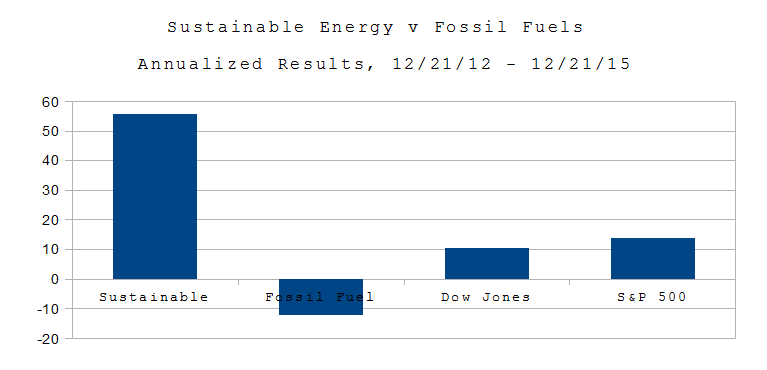
PLPort.1512On Dec. 21, 2012, I put $16 Million imaginary dollars in equal imaginary investments in 16 real energy companies; $8.0 in the Sustainable Energy space and $8.0 in the fossil fuel space. Excluding the value of dividends and transaction costs, but including the bankruptcy or crash of three companies in the sustainable energy space.

As of the close of trading on December 21, 2015:

  • The Fossil Fuel portfolio was worth $5.1 Million, down 36.23% overall, down 12.08% on an annualized basis.
  • The Sustainable Energy portfolio was worth $21.33 Million, up 166.6%, overall and 55.53% on an annualized basis.
  • The Dow Jones Industrial Average is up 31.8% overall and 10.6% on an annualized basis, from 13,091 on 12/21/12 to close at 17,252 on 10/21/15.
  • The S&P 500 is up 41.33% overall and 13.78% on an annualized basis, from 1,430 on 12/21/12 to close at 2,021 on 10/21/15.
  • If there’s a war on coal, it’s part of the war on fossil fuel – and fossil fuel is losing.

Continue reading

The Art of Gerrymandering – Part III

The State of Gerrymandering in these United States

1. The State of Gerrymandering in these United States

In our last post, we wrote about how to compute the Gerrymander Index of shapes, including Congressional districts. Since then we’ve fetched the U. S. Census Bureau tl_2014_us_cd114 Esri shapefile data set of the 435 Congressional Districts for the current 114th Congress, which includes the nine non-voting districts that send delegates to Congress. If you are terminally curious, download the comma-separated value text file of our results, based on Census Bureau dataset. We’re not going to discuss all 444 maps; restricting our attention to the best and the worst, the state of gerrymandering in these United States, and how the States of California and Texas are gerrymandering these days.

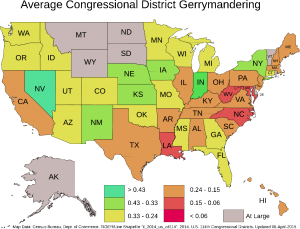
Of the four hundred forty four records in tl_2014_us_cd114, the most gerrymandered district is North Carolina Congressional District 12, with a Gerrymander Index of 0.0291, this based on its cartographic boundary as defined in the Census Bureau shape file.

Continue reading

COP 21 – the Future Began Yesterday

globe_west_540

Earth, The Blue Marble, courtesy NASA

COP 21 is, perhaps, the most important international effort in history. It concluded with an agreement by 196 nations to limit CO2 emissions to hold global temperature rise to 1.5 degrees Centigrade or 3.3 degrees Fahrenheit (NPR).

The only way to do this is to phase out fossil fuels, quickly, and replace them with efficient use of sustainable energy systems, i.e., solar, wind, geothermal, hydro, and insulation.

Continue reading

12,209 Americans Killed by Americans with Guns in 2015


san-bernadino-california.1

December 2, 2015, 19 Americans were killed and 21 wounded in four incidents, one dead, three wounded in Georgia (Atlanta Journal Constitution), two dead in Texas in two incidents (ABC News) and 14 killed and 17 wounded in San Bernardino, California (NPR). In addition, two of the alleged shooters in California were killed and a police officer was wounded in a subsequent shoot-out with police.

As President Obama said, “We have a pattern now of mass shootings in this country that has no parallel anywhere else in the world.”  (NY Daily News, ABC News, CBS News.)

A total of 12,209 Americans were shot to death in 350 incidents in the USA thus far in 2015, according to Gun Violence Archive. In 2014 the US population was 318.9 million. So the odds are 0.0038285% – 38.285 in a Million or 1 in 26 thousand (26,119.9) that YOU – or I – will be shot to death in America. That’s better that the one in 175 million chance of winning the Powerball Lottery (Ronald Wasserstein, Huffington Post, here).

Americans are 6,700 times more likely of being shot dead than winning Powerball.

Continue reading

Energy Portfolios, 2 Years 11 Months: Sustainable Energy Up 129.5%, Fossil Fuel DOWN 29.6%

PLPort.1511On Dec. 21, 2012, I put $16 Million imaginary dollars in equal imaginary investments in 16 real energy companies; $8.0 in the Sustainable Energy space and $8.0 in the fossil fuel space. Excluding the value of dividends and transaction costs, but including the bankruptcy or crash of three companies in the sustainable energy space,

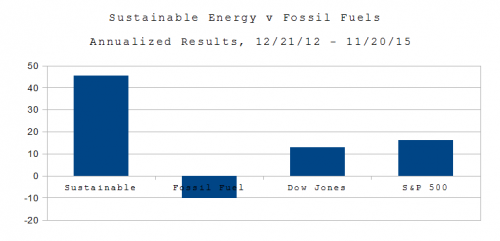
As of the close of trading on November 20, 2015:

  • The Fossil Fuel portfolio was worth $5.63 Million, down 29.57% overall, down 10.44% on an annualized basis.
  • The Sustainable Energy portfolio was worth $18.0 Million, up 129.50%, overall and 45.71% on an annualized basis.
  • The Dow Jones Industrial Average is up 36.15% overall and 10.44% on an annualized basis, from 13,091 on 12/21/12 to close at 17,824 on 10/21/15.
  • The S&P 500 is up 46.10% overall and 16.27% on an annualized basis, from 1,430 on 12/21/12 to close at 2,089 on 10/21/15.

It’s not a war on coal. It’s a paradigm shift.Think about it. We don’t use whale oil or kerosene for street lamps. We did, 100 years ago.

This of course, has geopolitical ramifications. It’s not just carbon dioxide, which is changing the climate and acidifying the oceans. Like Al Queda, Hamas and Hezbollah, ISIS finances its operations with petrodollars. (The difference is that Hamas is supported by Emirates and Kuwait, Hezbollah by Iran, Al Queda by our friends the Saudis, while ISIS has its own oil wells.) Earlier this year NJ’s Honorable Governor Chris Christie, a candidate for President, gave Exxon a $9 Billion gift (which is being challenged in the courts). BP was the beneficiary of the 1953 coup by the US under President Eisenhower and the UK which toppled the democratically elected government led by Prime Minister Mohammed Mossagedgh of Iran and propped up the Shah until the revolution in 1979.  Shell has spent something like $12 Billion in failed attempts to drill the Arctic. BP, Transocean and Halliburton brought us the Deepwater Horizon; Halliburton also profited from the US Led war in Iraq.

Continue reading

Energy Portfolios, 2 Years 10 Months: Sustainable Energy Up 125%, Fossil Fuel DOWN 27%

PLPort.1510On Dec. 21, 2012, I put $16 Million imaginary dollars in equal imaginary investments in 16 real energy companies; $8.0 in the Sustainable Energy space and $8.0 in the fossil fuel space. Excluding the value of dividends and transaction costs, but including the bankruptcy or crash of three companies in the sustainable energy space.

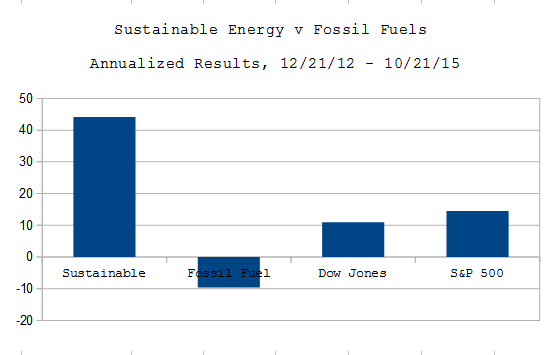
As of the close of trading on October 21, 2015:

  • The Fossil Fuel portfolio was worth $5.82 Million, down 27.3% overall, down 9.64% on an annualized basis.
  • The Sustainable Energy portfolio was worth $18.0 Million, up 125.0%, overall and 44.13% on an annualized basis.
  • The Dow Jones Industrial Average is up 31.15% overall and 10.99% on an annualized basis, from 13,091 on 12/21/12 to close at 17,169 on 10/21/15.
  • The S&P 500 is up 41.19% overall and 14.54% on an annualized basis, from 1,430 on 12/21/12 to close at 2,019 on 10/21/15.

Continue reading

Using EMV to Secure Social Security

FullSizeRender

Identity thieves want Social Security numbers matched with names, addresses and birthdays.

And they have them. By the Millions!

On 90 Million Americans! Possibly 200 Million!

They used Experian to get information on 15 million T-Mobile customers – and threaten everyone in Experian’s databases. They stole information on 90 million people whos health insurance is provided by Anthem Blue Cross or Excellus Blue Cross.  And 22 Million current and former employees of the U. S. government, by hacking Office of Personnel Management (OPM). Plus 58 million customers of Home Depot and 70 million customers of Target.   The problem is growing. They are also targeting parking services such as Book 2 Park, Park N Fly, and One Stop Parking.

The sets intersect – it is likely many Home Depot customers also shop Target, work for the government and or have health insurance from Blue Cross Blue Shield.  But it’s also likely that very few of the 10 million customers of Excellus Blue Cross are also customers of Anthem Blue Cross so we are looking at a problem for at least 90 Million Americans, 28% of the country. That’s almost one out of three. And 200 million? That’s 2 out of 3.

Continue reading

Energy Portfolios, 2 Years 9 Months: Sustainable Energy Up 111.3%, Fossil Fuel DOWN 33.5%

PL_Port.1509On Dec. 21, 2012, I put $16 Million imaginary dollars in equal imaginary investments in 16 real energy companies; $8.0 in the Sustainable Energy space and $8.0 in the fossil fuel space. Excluding the value of dividends and transaction costs, but including the bankruptcy or crash of three companies in the sustainable energy space,

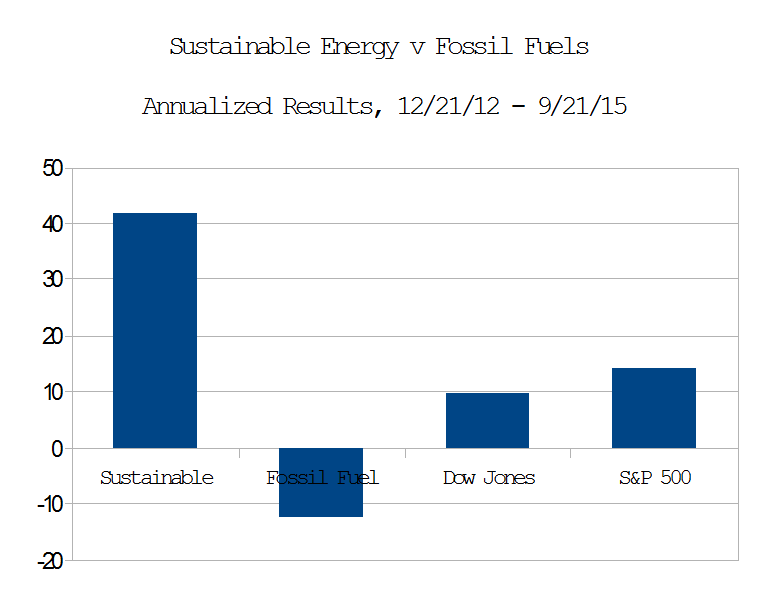
As of the close of trading on Sept. 21, 2015:

  • The Fossil Fuel portfolio was worth $5.32 Million, down 12.55% on an annualized basis.
  • The Sustainable Energy portfolio was worth $16.9 Million, up 41.74% annualized.
  • The Dow Jones Industrial Average is up 9.65% on an annualized basis, from 13,091 to 16,512 on 9/21/15.
  • The S&P 500 is up 14.3% on an annualized basis from 1,430 to close at 1,969.

Continue reading

The Art of Gerrymandering – Part II

gerry_00

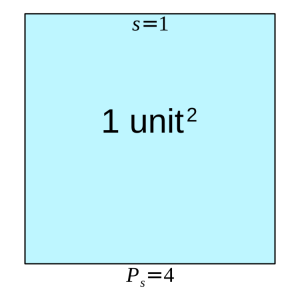
1. Four units of rope make a square, one unit on a side, and encompasses an area of 1 square unit.

Suppose you had a piece of rope. Your aim is to encompass as much area as possible. The rope doesn’t stretch or shrink, nor break no matter how hard it’s pulled – it’s good rope. Could be made out of cytoplastic nanotubes or something.

No matter if you measure your rope in inches, miles or centimeters. Just invent a fiat measure defined as one quarter of the length of the rope, then stake out a square. Each side is one unit and the square’s perimeter is four units. The square’s area is the square of a side: 1 unit × 1 unit = 1 unit2.

That’s all well and good, but are we encompassing the most area that we can with this rope? A regular octagon suggests otherwise:
gerrymander one

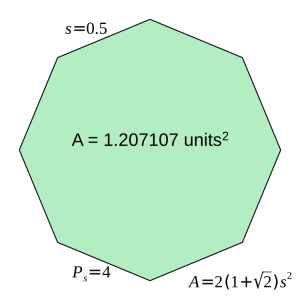
2. Four units of rope also make a regular octagon, 1/2 unit to a side. In this case, the same amount of rope encloses 1.207 square units, a bit more than 1/5th additional area beyond that of a square.

For the same amount of rope, a regular octagon encompasses a little more than 1.20711 times the area encompassed by a square.

We arrived at this regular octagon by applying a modification rule to the square: we halved the sides, doubled their number and made all the interior angles the same. That gave us a polygon that encompassed more area than the square for the same perimeter, four units.
Gerrymander Three

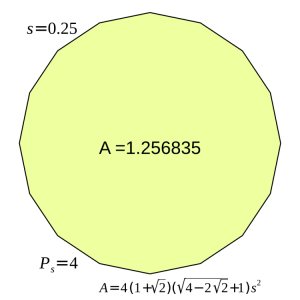
3. Four units of rope also make a regular hexadecagon, 1/4 unit to a side, with sixteen sides equalling four units of rope. In this case, the same amount of rope encloses 1.256 square units, a wee bit better than that of an octagon.

Halving the length of the sides yet again, increasing their number by two, gives rise to a hexadecagon which encompasses an even greater area: 1.256 square units surrounded by four units of rope, divided into 16 sides of one quarter unit each.

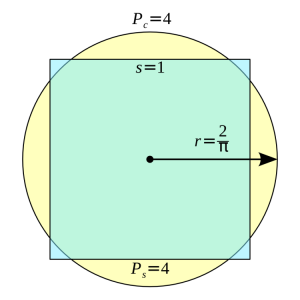
You can see where this goes – as the number of sides increase, the regular polygon more nearly approximates a circle. So, by the miracle of calculus, we magically increase the number of sides up through a regular myriagon (10,000 sides) past the regular apeirogon (an countable infinity of sides) arriving at the limit figure: the circle, which encompasses the largest possible area for a given perimeter: about 1.27324 square units for a rope four units long.
gerrymander four

4. A circle with a radius of 2 over pi has a perimeter of four units and an area of 4 over pi, about 1.27324. Compare this to the unit square with a perimeter of the same length, but which only has an area of one unit square.

This is the essence of the Gerrymander Index (GI): any perimeter P of a given shape S that encompasses a particular area Ap, also encompasses a circle with the maximum possible area, Ac. The Gerrymander Index for that particular shape S with perimeter P is then:

[pmath size=12]GI_P = A_p/A_c[/pmath]

The Gerrymander Index is a computable property of a particular shape. It is a unitless measure arising from a ratio of areas and compares a shape’s area with that of the circle whose circumference equals the shape’s perimeter. When the shape is that circle, the Gerrymander Index is one, the ideal. Line segments, which do not have interior areas, have Gerrymander Indices of zero. All shapes that encompass some interior area, but are not circles, have Gerrymander Indices that fall somewhere between one (circle-like) and zero (line-like).

The Gerrymander Index is independent of size. The index compares the area of a shape relative to that of the circle with an equal perimeter, hence they “scale together.” We may compare Gerrymander Indices of huge, rural Congressional districts with block-sized urban districts without getting into apples-versus-oranges side debates on whether size matters.

To get a feel for this index, consider our unit square. It has a Gerrymander Index of 1.00000 (Ap) divided by 1.27324 (Ac): GIsquare = 0.785398. Most people would think of a square Congressional district as not being especially gerrymandered, so a GI of 0.7 – 0.8 can be considered “quite decent.”

The regular octagon with a perimeter of four units and area of 1.20711 square units has a Gerrymander index of 1.20711 divided by 1.27324, or 0.94806 – very nearly circular and probably too good to be seen much in the real world. The regular hexadecagon weighs in with a Gerrymander Index of 1.25684 ÷ 1.27324 = 0.98712 – a hair shy of a circle and too good to be true.

Gerrymander Five

5. A tiny bridge connects two shapes with original GerryMander indices of about 0.98, but the index for the combined shape plummets to 0.507.

Conversely, we can combine a couple of shapes, each with a pretty good Gerrymander Index, into one that doesn’t have a particularly great index. The two circular regions in Illustration 5 on their own have Gerrymander Indices of 0.98. The tiny connection bridge linking them gives rise to an overall “dumb-bell” shape with a Gerrymander Index of just 0.507.

How does the Gerrymander Index fit in with the Great National Discourse, at least insofar as Congressional Districts are concerned?

Justin Levitt, on the faculty of Loyola Law School in Los Angeles, furnishes us with a summary table of the criteria that various state level redistricting organizations follow. Thirty seven states include some sort of “compactness” guideline, but as Prof. Levitt points out, the precise meaning of “compactness” is often wanting, with definitions using language that the shape should be “regular” or that voters in a district should “live close together” or not be “far-flung.” This kind of language wanders around the concept of a numerical index, but doesn’t hit it on the head, leaving quite a bit of interpretive play. Different observers of a particular Congressional district may form different impressions of how “compact” that district is.

In contrast, the GI injects a hard number, one based solely on the geometry of a Congressional District. It enables us to discuss how much a particular district is like a circle. One is not obliged to consider the various political forces that caused a district to be shaped in a particular way. One only needs to apply a technique – taking a ratio of two areas, one that the perimeter encompasses, the other that a circle with an equivalent perimeter encompasses.

A hard number such as the Gerrymander Index allows us to consider particular thresholds. We might argue, for example, that any proposed district with a Gerrymander Index below 0.03 be disallowed as “too contorted”. Of course, that threshold is subject to debate and should be debated. We just wish to point out that at this juncture, the Gerrymander Index makes such a debate possible, as it is a concrete property of the shape.

Alternatively, we can set a threshold on the downward change in the Gerrymander Index from one re-districting effort to the next. Illustration 5 makes the point visually. Two districts with quite excellent GI’s of 0.98 are combined to produce a new district with a GI of 0.507, a downward plunge of 0.473. What if downward changes in GI were limited to a threshold of 0.2, while upward changes in any measure would be allowed? Such a policy would grandfather badly drawn districts initially, but over time, with significant GI drops disallowed, Congressional districts would all tend to compactness, with higher GI indices becoming the norm.

A word of caution is in order. The Gerrymander Index stems from the length of a shape’s perimeter. That comes from a map. To what precision is a map measured? The astute will now recognize that we teeter on the edge of the coastline paradox, attributed by Benoit Mandelbrot to mathematician Lewis Fry Richardson.

Two maps of the State of New York, each published by the U. S. government, illustrate the paradox.
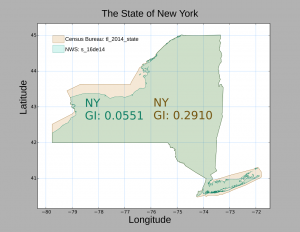
The State of New York as published by the Census Bureau (tan) in mapset "tl_2014_state" Overlaid in turquoise, the State of New York as published by the National Weather Service in "mapset s_16de14". The inclusion of shoreline data causes the GI to plunge from 0.291 to 0.055.

6. The State of New York as published by the Census Bureau (tan) in mapset “tl_2014_state” Overlaid in turquoise, the State of New York as published by the National Weather Service in “mapset s_16de14”. The inclusion of shoreline data causes the GI to plunge from 0.291 to 0.055.

The Census Bureau clearly documents that their maps are for display and illustration. They deliberately simplify coastlines along large bodies of water, though political borders are carefully drawn.

For our purposes, this illustration reminds us that we cannot talk or write about Gerrymander Indices in isolation. The index is absolutely keyed to the map from which it is calculated, and in honest debate, the source of maps must always be mentioned.

As remarked in our second technical note, we use the Census Bureau map sets because those are the ones from which Congressional Districts have been published. As it so happens, the pruning of complex coastlines usually put Congressional districts in a more favorable light. For example, the 1st Congressional District of New York, currently occupying the eastern third of Long Island, would be “naturally gerrymandered” by the North and South Forks, the tiny islands between the two, and the barrier islands running along the south shore. The simplifications applied in the Census Bureau maps omits those details from the map.

So long as we are clear that we ground our Gerrymander Index on this particular map set, and agree that Census Bureau modifications serve technical purposes only, there should be no cause for “apples v. oranges” debates. Though in the polarized atmospheres that encompass much 21st Century political discourse, such an agreement could be hard to obtain in practice.

Next and Last Part: Some of our favorite Gerrymanders.

Technical Note 1: Isoperimetric Index

The Gerrymander Index is not entirely original with this author. Dr. James Case presented a similar formulation in the SIAM Journal in 2007, and his sources trace the technique back to ancient Greece, so even Pythagoreans had some notion of a gerrymandering index.

Case reports on a unitless measure arising from a ratio of areas, but for the numerator he takes the area formed by the length of a shape’s perimeter, Pand compares this with the area 4πAp, the denominator, with Ap equal to the area of the shape encompassed by P. If P happens to be circular, then the value P2 will equal 4πAp, the numerator and denominator have the same value and the ratio of the two areas becomes one.  This arises from the relation that couples a circle’s circumference (perimeter) to its area: A =πr2; P = 2πr; P2 = 4π2r2; P2 = 4π(πr2); P2 = 4πA. Thus, the ideal in Dr. Case’s “isoperimetric index” is identical to the Gerrymander Index: unity.

The usual non-circular case may be reached by holding Ap constant and pulling, pushing and twisting the perimeter P out of round so that it grows in length, encompassing the fixed area Ap less and less efficiently. It becomes more contorted and “longer,”  leaving P2 > 4πA, the isoperimetric index exceeding one.

The isoperimetric index behaves somewhat like the inverse of the Gerrymander Index, reporting divergence from the circular ideal with ever-larger numbers. This is a technical difference. Conceptually, it too is a hard number and enters into the Great Discourse the same way that the Gerrymander Index does: injecting numeric precision into a debate that suffers from fuzziness.

Technical Note 2: The Area of Arbitrary-Shaped Closed Polygons

Few shapes in the real world, Congressional Districts included, come with neat formulae that give exact areas; the world is fractal. So how does one deal with the realities of Illinois Congressional District #4?

Computational geometry gives us one method that does not constrain us too much, so long as we limit ourselves to closed polygons with sides only consisting of line segments and which do not self-intersect. That is, our polygon lays “flat” on a surface without any part of it folding over any other part. When the shape does not self-intersect, it may be stretched topologically into a circle. If reshaping entails one or more holes, like a doughnut, then the shape has intersected itself. Barring that, and with only line segments for sides, a shape may be otherwise arbitrarily convoluted.

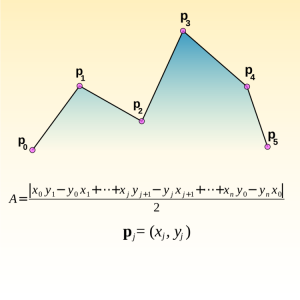
This is the kernel operation. It produces an area fragment, Aj: , corresponding to adjacent vertices (xj, yj) and (xj+1, yj+1):

[pmath]({x_j}{y_{j+1}} – {y_j}{x_{j+1}})/2[/pmath]

The kernel operation works on pairs of adjacent vertices, j and j+1. We start with vertex zero and one, apply the kernel operation, go on to vertex one and two, apply the kernel operation, and so on, until we come to the final pair, which is the very last vertex paired with the very first. We add up the area fragments and take the absolute value of the sum. This gives us the area of the arbitrary polygon. The absolute value operation disguises the fact that walking counterclockwise around a polygon calculates a negative area. This may unsettle the casual reader. Negative areas have their uses but we’ll put such aside and just take the absolute value of the numerator.
Gerrymander Six

6. The area of an arbitrary polygon arises from a sum of “area fragments”, each composed from pairs of adjacent vertices.

Usually, polygonal datasets for congressional districts consist of thousands to tens of thousands of vertices, making this effort a bit tedious for paper-and-pencil work. That’s what computers are for.

Where do we get our data? The U. S. Census Bureau furnishes data on the shapes of 2013 Congressional districts in the form of Esri Shapefiles, which meet these criteria and are available to the public from the Census Bureau product page. With the exception of Minnesota, these shapefiles also describe the districts for the current 114th Congress. These files come in different resolutions to serve varying display purposes.  TIGER® (Topologically Integrated Geographic Encoding and Referencing)/Line shapefiles are for high resolution work; they can get quite large. Cartographic Boundary shapefiles are light-weight, low-resolution versions of the Line files: quick to down-load, easy to render, but furnish only somewhat coarse approximations of a political boundary. We use the TIGER/Line files for Gerrymander Index computations.

What do we do with our data? Get a shapefile reader, which come in a variety of shapes and sizes, and do a bit of scripting for the Gerrymander math. For this series, we use the Python scripting language to do our math and Joel Howland’s pyshp module to interface with Esri Shapefiles. This is a lightweight approach for those accustomed to scripting. It’s how we made our pictures, too.

For those who just want to load and visualize, one needs GIS software. These too come in a variety of shapes and sizes, but none, at the moment, give readings on either isoperimetric or Gerrymander indices. High-end jobs like GRASS can take add-ons written in a variety of languages, so one could, in principle, add a Gerrymander Index calculator. GRASS is a world unto itself, however, so we didn’t go that route, wishing to finish this post before the century closed. There are also online communities centered on web-based geodata. Google Maps is the best known, and lets users integrate Shapefiles. Injecting custom calculators into the mix do not seem possible at the moment, but there is always the future.

Further Reading

  1. “James Case “Flagrant Gerrymandering: Help from the Isoperimetric Theorem?”” SIAM News, Volume 4 Number 9, November 2007

  2. H. R. 1347 (114th Congress, 2015-2017) John Tanner Fairness and Independence in Redistricting Act

  3. Justin Levitt All About Redistricting “Where are the lines drawn?”
The Art of Gerrymandering – Part I

gerrymander_00

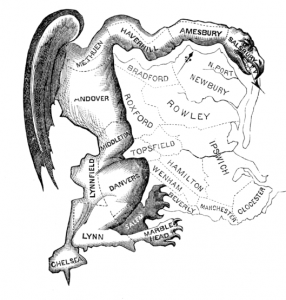
The Original Gerry Mander

The Constitution tasks the House of Representatives with setting the number of U. S. citizens that its members may represent. The Apportionment Act of 1792 fixed the House of Representatives for the Third Congress at 105 members, one Representative for 33,000 constituents. The Census of 1790, first of its kind, found the young nation numbering around 3,900,000 individuals. For purposes of computing the ratio of representatives to those represented, slaves constituted three-fifths of a free person.

112 years on, 1901, roughly midway between the Constitution’s ratification and the present day, each Representative of the 57th Congress fielded the concerns of 213,000 people and carried a six-fold increase in “representational load” over his 1792 counterpart. The House then had 357 members representing around 76 million. Had the House stayed with its 1792 ratio of one Representative to 33,000 constituents, it would have had 2,303 members in 1901, far more than what the seating in the south wing of the Capitol building could accommodate.

114 years on, the 114th Congress finds a House of 435 voting members, a number which has been fixed since the Apportionment Act of 1911. These worthies now represent about 309 million, or roughly 710,000 citizens per Representative, a four-fold increase over the 1901 representational load and a twenty-four fold increase over that of 1792. At the original ratio, the House would have almost 9,364 members, a number making for a mad house – though some think it is anyway.

Continue reading

China has a Great Wall. But there is no Wall Street.

Fake_Bull

When stocks on the Shanghai Securities Exchange, the SSE, “corrected” on August 24, 2015, stocks in US and other markets followed. But nothing has fundamentally changed. None of the “Fundamentals” on any publicly traded U.S. or European companies have significantly changed (other than the Market Capitalization and Price Earnings ratios, which are, of course, functions of the stock price). Earnings per Share, EPS, the existence or lack thereof of what Warren Buffett calls a “moat,” debt to asset ratios, return on income, other financial ratios, were and remain unaffected by day to day fluctuations of stock price.

chargingbull

Charging Bull, by Arturo Di Monica

Stocks that were fundamentally bad investments on Friday, August 21, 2015 were likely to have been bad investments on Tuesday. August 25, 2015. Stocks that were good investments on Friday, August 21, 2015, were fundamentally somewhat better investments on Tuesday. August 25, 2015.

Dancer on the Markets

Dancing on the Charging Bull

The SSE Composite is not the S&P 500, or even the Dow. While there are frequent scandals involving insider trading and other financial improprieties, they are the exception and there are regulations designed to keep them that way. China, on the other hand …

The Shanghai Stock Exchange Composite index, the SSE Composite, looks kind of like the S&P 500. However, there are key differences between the indices.

Continue reading

Popular Logistics Energy Portfolios and “The Correction”

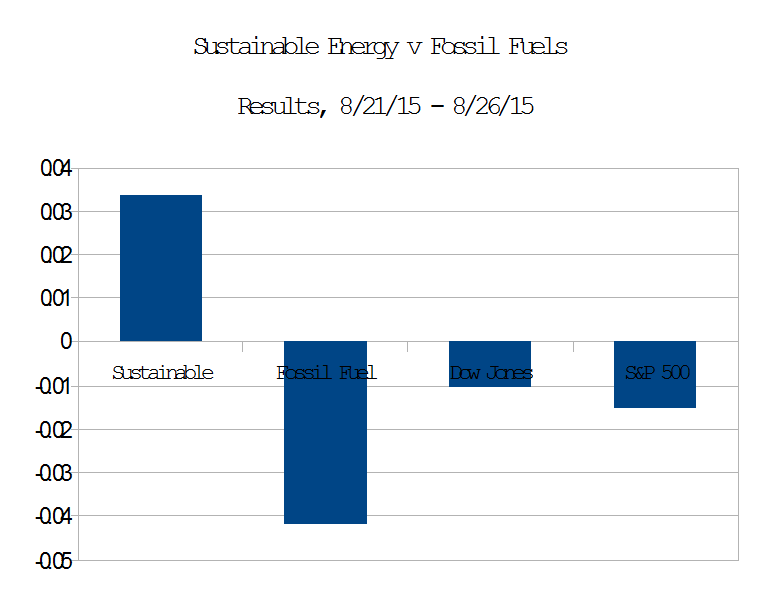
PL_Port.1508bAccording to Adam Haigh, Bloomberg Business the current stock market valuation “Correction” may be complete. Meanwhile, in the microeconomic world of energy, as illustrated above, the Sustainable Energy portfolio” I created in December, 2012, here, rose slightly above the close of trading Friday, August 21, 2015, while the Fossil Fuel portfolio, the S&P 500 index and the Dow Jones Industrial average closed below their values at the close of trading on 21 August, 2015.

Mr. Haigh, in  Asian Stocks Rise as U.S. Equity Rout Halted; China Futures Gain, wrote,

Asian stocks rose for a second day after U.S. shares halted a six-day rout.

The MSCI Asia Pacific Index gained 0.9 percent to 127.93 as of 9:05 a.m. in Tokyo. The Standard & Poor’s 500 Index jumped 3.9 percent, the most since 2011. Two things that have supported U.S. stocks in the past, dovish words from the Federal Reserve and improved economic data, halted a plunge that erased $2.2 trillion from equity values.

But the long term trend in energy stocks, first reported by me here in February, 2013, appears to be persistent. Solar and Wind stocks may be continuing to climb; Fossil fuel stocks may be continuing to decline. Either or both of these trends could, of course, reverse.

The data are summarized beginning in Table 1, below. Continue reading

Energy Portfolios, 2 years 8 months Sustainable Energy Up 103%, Fossil Fuel DOWN 34%

PLPort.1508On Dec. 21, 2012, I put $16 Million imaginary dollars in equal imaginary investments in 16 real energy companies; $8.0 Million in the Sustainable Energy space and $8.0 Million in the fossil fuel space. Excluding the value of dividends and transaction costs, but including the bankruptcy or crash of three companies in the sustainable energy space,

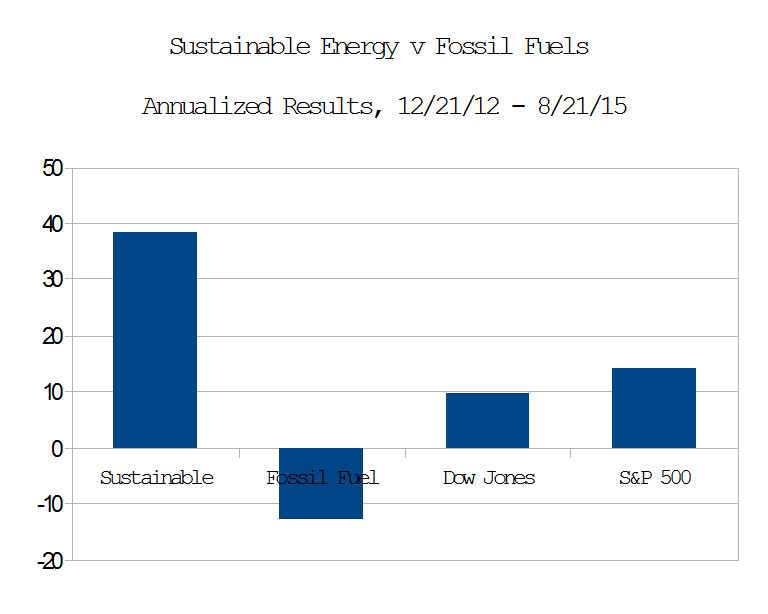
  • The Fossil Fuel portfolio is now worth $5.26 Million, down 34.28% overall, 12.85% on an annualized basis.
  • The Sustainable Energy portfolio is now worth $16.2 Million, up 102.6%, 38.48% on an annualized basis.
  • The Dow Jones Industrial Average is up 25.74%, 9.65% on an annualized basis, from 13,091 on 12/21/12 to close at 16,460 on 8/21/15.
  • The S&P 500 is up 37.8%, from 1,430 to close at 1,971 on 8/21/15.
  • The Fossil Fuel and Sustainable Energy portfolios, like the indices, are down in the last month.

The conclusion, that investors are moving away from Fossil Fuels and into Sustainable Energy, seems logical, if not obvious.

Continue reading

On New Jersey’s Energy Master Plan

On August 17, 2015, I attended the Board of Public Utilities, BPU, hearings regarding New Jersey’s Energy Master Plan, EMP.

The beach and cyclone at Seaside Heights, NJ, before and after Hurricane Sandy, Oct. 2014

The beach and cyclone at Seaside Heights, NJ, before and after Hurricane Sandy, Oct. 2014

A lot of people, myself included, spoke about Sandy. (Photos, click here).

Many spoke of the need for the BPU to act independently of the Governor and think long term.

No one spoke about a need or want for more fossil fuels or more nuclear.

The lobbyist from the NJ GCA, The Gasoline, C-Store, Automotive Association told the commissioners how happy he was that he installed a solar energy system on his home and said that gas stations need robust electricity. They can’t simply install emergency generators that burn diesel or gasoline.

Image of the Lillgrund, Sweden wind farm, courtesy of Siemens

Lillgrund, Sweden, courtesy Siemens

I called for: 140% clean, renewable, sustainable electricity by 2030:

  • Solar: 3.5 GW
  • Wind: 3.5 GW
  • Batteries: 1.5 GW
  • Biofuel: 1.5 GW

Including:

  • 250 MW of solar in a 100 KW array on each of the 2500 public schools,
  • 125 MW of battery backups, in a 50 KW Tesla Powerwall or equivalent system on each public school,
  • These would give us emergency shelters, with power, in every community in New Jersey.
  • A Capstone microturbine, or the equivalent at each sewage treatment plant.

These, I explained, would make the grid more resilient.

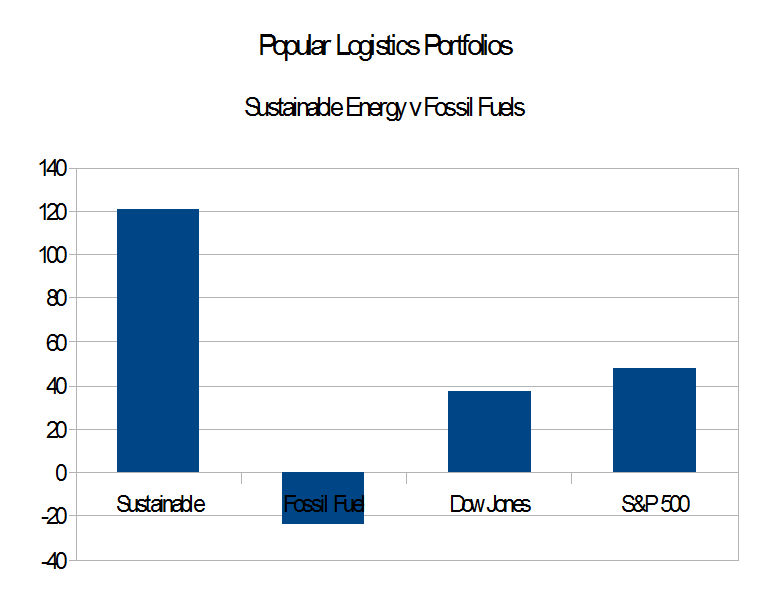
I also added that Wall Street appears to be abandoning fossil fuels. This observation is based on the data collected from Dec. 12, 2012, and published on Popular Logistics, here, that show that for the period from Dec. 21, 2012 to July 21, 2015,

  • Sustainable Energy: Up 121%, 46.7% per year.
  • Fossil Fuel: DOWN 25% overall, -9.26% per year,
  • S&P 500: Up 47.54%, 18.41% per year.

The full text of my prepared remarks is below:

Continue reading

Energy Portfolios, 2 years 7 months Sustainable Energy Up 121%, Fossil Fuel DOWN 24%

PLPort.1507On Dec. 21, 2012, I put $16 Million imaginary dollars in equal imaginary investments in 16 real energy companies; $8.0 in the Sustainable Energy space and $8.0 in the fossil fuel space. Excluding the value of dividends and transaction costs, but including the bankruptcy or crash of three companies in the sustainable energy space.
  • The Fossil Fuel portfolio is now worth $6.09 Million, down 23.93%.
  • The Sustainable Energy portfolio is now worth $17.64 Million, up 120.54%.
  • Both Fossil Fuel and Sustainable Energy are down slightly in the last month.
  • The Dow Jones Industrial Average is up 37.6%, from 13,091 on 12/21/12 to close at 18,016 on 7/21/15.
  • The S&P 500 is up 47.6%, from 1,430 to close at 2,110 on 7/21/15.

Continue reading