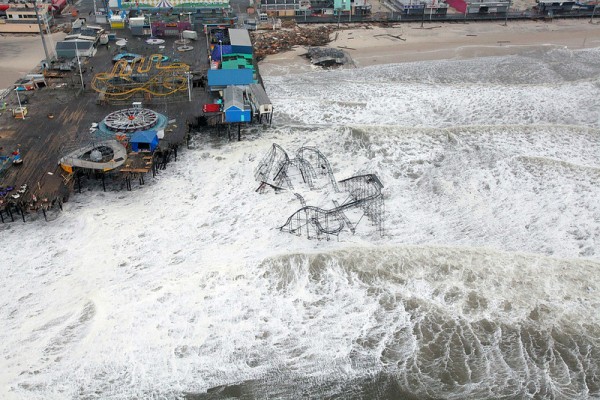
Jersey Shore Damage from Hurricane Sandy. U.S. Air Force photo by Master Sgt. Mark C. Olsen
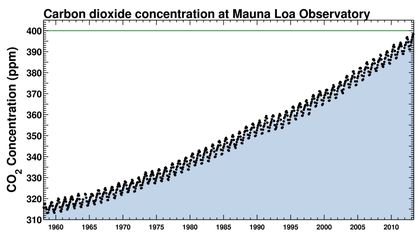
Approximately 97% of climate scientists agree that climate-warming trends over the past century are very likely due to human activities, which have increased atmospheric CO2 from roughly 265 parts per million, PPM, in 1800 to 400 PPM today. Many of these scientists and climate experts agree we must reduce the amount of CO2 in the atmosphere from current levels to below 350 PPM.
Along with climate-warming comes extreme weather, and events like Hurricane Irene, 2011, Hurricane Sandy, 2012. 350 Jersey Shore aims to inform New Jersey residents of our climate challenges, and provide solutions to help reduce carbon emissions locally and beyond.
Organized by Stephen Fowler of Echo Movement, 350 Jersey Shore, an arm of 350.0rg is meeting on Tuesday, Sept. 3, 2013 at 6:00 PM at the Stay Gold Cafe, Belmar, NJ. ( Event Link )