Author Archives: L J Furman, MBA

About L J Furman, MBA

Analyst here and Director of Information Technology with an MBA in Managing for Sustainability.

Using EMV to Secure Social Security

FullSizeRender

Identity thieves want Social Security numbers matched with names, addresses and birthdays.

And they have them. By the Millions!

On 90 Million Americans! Possibly 200 Million!

They used Experian to get information on 15 million T-Mobile customers – and threaten everyone in Experian’s databases. They stole information on 90 million people whos health insurance is provided by Anthem Blue Cross or Excellus Blue Cross.  And 22 Million current and former employees of the U. S. government, by hacking Office of Personnel Management (OPM). Plus 58 million customers of Home Depot and 70 million customers of Target.   The problem is growing. They are also targeting parking services such as Book 2 Park, Park N Fly, and One Stop Parking.

The sets intersect – it is likely many Home Depot customers also shop Target, work for the government and or have health insurance from Blue Cross Blue Shield.  But it’s also likely that very few of the 10 million customers of Excellus Blue Cross are also customers of Anthem Blue Cross so we are looking at a problem for at least 90 Million Americans, 28% of the country. That’s almost one out of three. And 200 million? That’s 2 out of 3.

Continue reading

Energy Portfolios, 2 Years 9 Months: Sustainable Energy Up 111.3%, Fossil Fuel DOWN 33.5%

PL_Port.1509On Dec. 21, 2012, I put $16 Million imaginary dollars in equal imaginary investments in 16 real energy companies; $8.0 in the Sustainable Energy space and $8.0 in the fossil fuel space. Excluding the value of dividends and transaction costs, but including the bankruptcy or crash of three companies in the sustainable energy space,

As of the close of trading on Sept. 21, 2015:

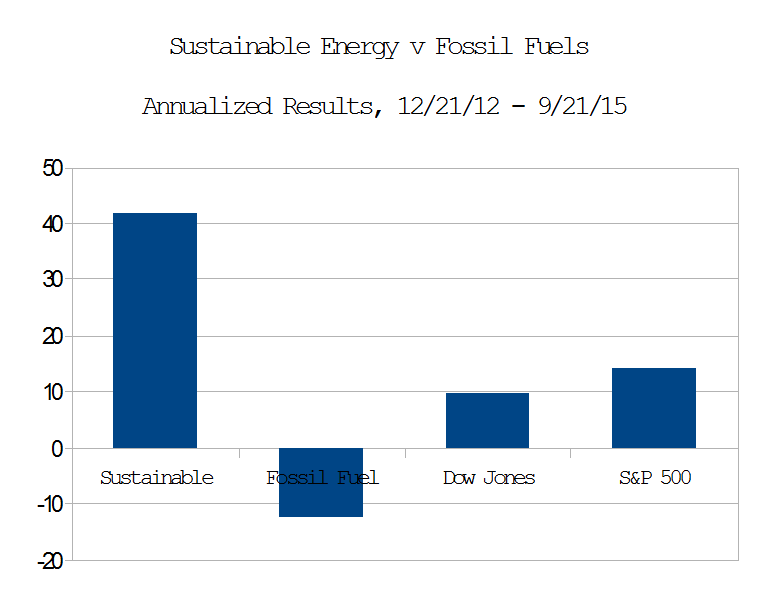
  • The Fossil Fuel portfolio was worth $5.32 Million, down 12.55% on an annualized basis.
  • The Sustainable Energy portfolio was worth $16.9 Million, up 41.74% annualized.
  • The Dow Jones Industrial Average is up 9.65% on an annualized basis, from 13,091 to 16,512 on 9/21/15.
  • The S&P 500 is up 14.3% on an annualized basis from 1,430 to close at 1,969.

Continue reading

China has a Great Wall. But there is no Wall Street.

Fake_Bull

When stocks on the Shanghai Securities Exchange, the SSE, “corrected” on August 24, 2015, stocks in US and other markets followed. But nothing has fundamentally changed. None of the “Fundamentals” on any publicly traded U.S. or European companies have significantly changed (other than the Market Capitalization and Price Earnings ratios, which are, of course, functions of the stock price). Earnings per Share, EPS, the existence or lack thereof of what Warren Buffett calls a “moat,” debt to asset ratios, return on income, other financial ratios, were and remain unaffected by day to day fluctuations of stock price.

chargingbull

Charging Bull, by Arturo Di Monica

Stocks that were fundamentally bad investments on Friday, August 21, 2015 were likely to have been bad investments on Tuesday. August 25, 2015. Stocks that were good investments on Friday, August 21, 2015, were fundamentally somewhat better investments on Tuesday. August 25, 2015.

Dancer on the Markets

Dancing on the Charging Bull

The SSE Composite is not the S&P 500, or even the Dow. While there are frequent scandals involving insider trading and other financial improprieties, they are the exception and there are regulations designed to keep them that way. China, on the other hand …

The Shanghai Stock Exchange Composite index, the SSE Composite, looks kind of like the S&P 500. However, there are key differences between the indices.

Continue reading

Popular Logistics Energy Portfolios and “The Correction”

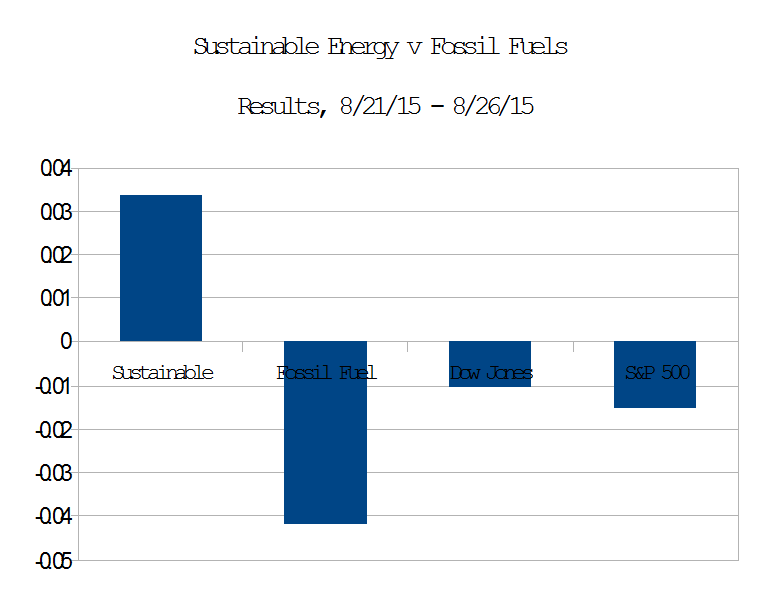
PL_Port.1508bAccording to Adam Haigh, Bloomberg Business the current stock market valuation “Correction” may be complete. Meanwhile, in the microeconomic world of energy, as illustrated above, the Sustainable Energy portfolio” I created in December, 2012, here, rose slightly above the close of trading Friday, August 21, 2015, while the Fossil Fuel portfolio, the S&P 500 index and the Dow Jones Industrial average closed below their values at the close of trading on 21 August, 2015.

Mr. Haigh, in  Asian Stocks Rise as U.S. Equity Rout Halted; China Futures Gain, wrote,

Asian stocks rose for a second day after U.S. shares halted a six-day rout.

The MSCI Asia Pacific Index gained 0.9 percent to 127.93 as of 9:05 a.m. in Tokyo. The Standard & Poor’s 500 Index jumped 3.9 percent, the most since 2011. Two things that have supported U.S. stocks in the past, dovish words from the Federal Reserve and improved economic data, halted a plunge that erased $2.2 trillion from equity values.

But the long term trend in energy stocks, first reported by me here in February, 2013, appears to be persistent. Solar and Wind stocks may be continuing to climb; Fossil fuel stocks may be continuing to decline. Either or both of these trends could, of course, reverse.

The data are summarized beginning in Table 1, below. Continue reading

Energy Portfolios, 2 years 8 months Sustainable Energy Up 103%, Fossil Fuel DOWN 34%

PLPort.1508On Dec. 21, 2012, I put $16 Million imaginary dollars in equal imaginary investments in 16 real energy companies; $8.0 Million in the Sustainable Energy space and $8.0 Million in the fossil fuel space. Excluding the value of dividends and transaction costs, but including the bankruptcy or crash of three companies in the sustainable energy space,

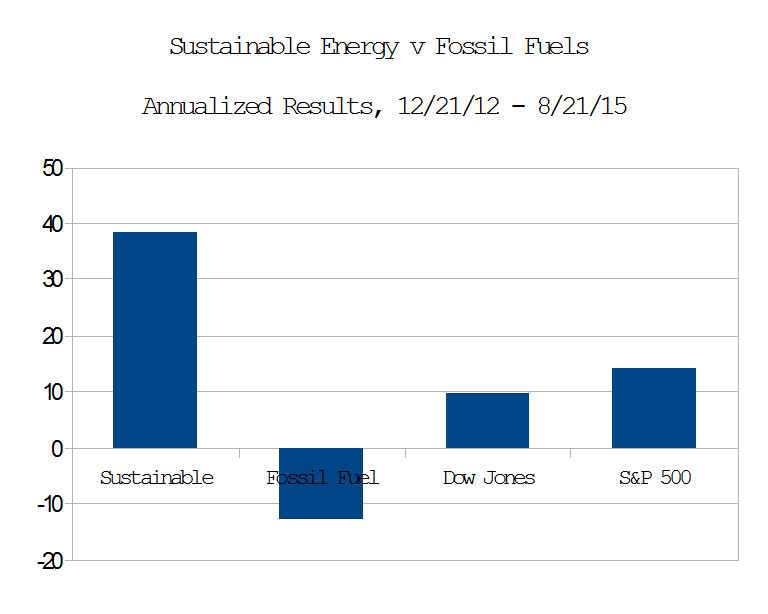
  • The Fossil Fuel portfolio is now worth $5.26 Million, down 34.28% overall, 12.85% on an annualized basis.
  • The Sustainable Energy portfolio is now worth $16.2 Million, up 102.6%, 38.48% on an annualized basis.
  • The Dow Jones Industrial Average is up 25.74%, 9.65% on an annualized basis, from 13,091 on 12/21/12 to close at 16,460 on 8/21/15.
  • The S&P 500 is up 37.8%, from 1,430 to close at 1,971 on 8/21/15.
  • The Fossil Fuel and Sustainable Energy portfolios, like the indices, are down in the last month.

The conclusion, that investors are moving away from Fossil Fuels and into Sustainable Energy, seems logical, if not obvious.

Continue reading

On New Jersey’s Energy Master Plan

On August 17, 2015, I attended the Board of Public Utilities, BPU, hearings regarding New Jersey’s Energy Master Plan, EMP.

The beach and cyclone at Seaside Heights, NJ, before and after Hurricane Sandy, Oct. 2014

The beach and cyclone at Seaside Heights, NJ, before and after Hurricane Sandy, Oct. 2014

A lot of people, myself included, spoke about Sandy. (Photos, click here).

Many spoke of the need for the BPU to act independently of the Governor and think long term.

No one spoke about a need or want for more fossil fuels or more nuclear.

The lobbyist from the NJ GCA, The Gasoline, C-Store, Automotive Association told the commissioners how happy he was that he installed a solar energy system on his home and said that gas stations need robust electricity. They can’t simply install emergency generators that burn diesel or gasoline.

Image of the Lillgrund, Sweden wind farm, courtesy of Siemens

Lillgrund, Sweden, courtesy Siemens

I called for: 140% clean, renewable, sustainable electricity by 2030:

  • Solar: 3.5 GW
  • Wind: 3.5 GW
  • Batteries: 1.5 GW
  • Biofuel: 1.5 GW

Including:

  • 250 MW of solar in a 100 KW array on each of the 2500 public schools,
  • 125 MW of battery backups, in a 50 KW Tesla Powerwall or equivalent system on each public school,
  • These would give us emergency shelters, with power, in every community in New Jersey.
  • A Capstone microturbine, or the equivalent at each sewage treatment plant.

These, I explained, would make the grid more resilient.

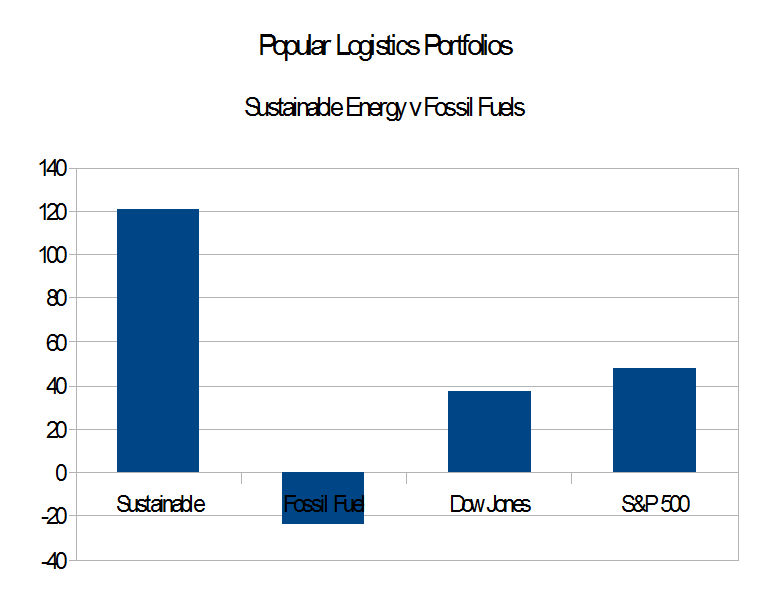
I also added that Wall Street appears to be abandoning fossil fuels. This observation is based on the data collected from Dec. 12, 2012, and published on Popular Logistics, here, that show that for the period from Dec. 21, 2012 to July 21, 2015,

  • Sustainable Energy: Up 121%, 46.7% per year.
  • Fossil Fuel: DOWN 25% overall, -9.26% per year,
  • S&P 500: Up 47.54%, 18.41% per year.

The full text of my prepared remarks is below:

Continue reading

Energy Portfolios, 2 years 7 months Sustainable Energy Up 121%, Fossil Fuel DOWN 24%

PLPort.1507On Dec. 21, 2012, I put $16 Million imaginary dollars in equal imaginary investments in 16 real energy companies; $8.0 in the Sustainable Energy space and $8.0 in the fossil fuel space. Excluding the value of dividends and transaction costs, but including the bankruptcy or crash of three companies in the sustainable energy space.

  • The Fossil Fuel portfolio is now worth $6.09 Million, down 23.93%.
  • The Sustainable Energy portfolio is now worth $17.64 Million, up 120.54%.
  • Both Fossil Fuel and Sustainable Energy are down slightly in the last month.
  • The Dow Jones Industrial Average is up 37.6%, from 13,091 on 12/21/12 to close at 18,016 on 7/21/15.
  • The S&P 500 is up 47.6%, from 1,430 to close at 2,110 on 7/21/15.

Continue reading

Greece, Antiquities and a Far Out Way Out

Elgin Marbles in the British Museum

The National Debt of Greece, according to National Debt Clocks . Org, here, as of Thursday, July 10, 2015, 10:45 PM EST, was $380 Billion USD and 345 Billion Euros.

A lot of money, but only $32k EU per person, only slightly higher than the typical American college student’s debt. (US News reported, here, “69 percent [of 2013 graduates] left school with an average of $28,400 in student loan debt.”)

But back to Greece …

Continue reading

Deepwater Horizon may cost BP $53.8 Billion – 43.1% of it’s current value

Image of the fire from the oil spill

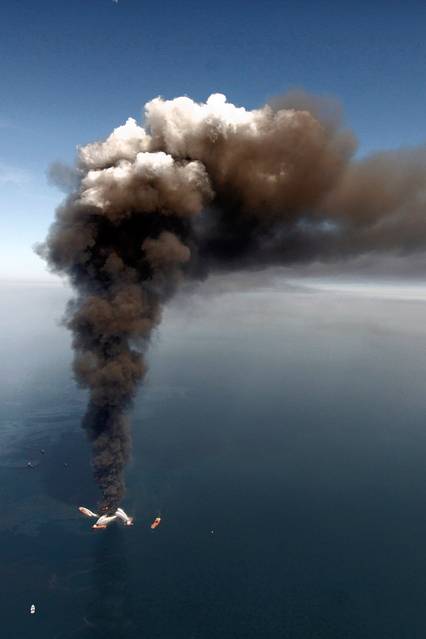
Deepwater Horizon Spill in 2010. Photo: Gerald Herbert, AP.

11 Crew were lost in the explosion and fire on the Deepwater Horizon rig on April 20, 2010. In addition, roughly 5.2 million barrels of oil poured into the Gulf of Mexico during the 87 days between April 20, 2010 when the explosion occurred and July 15, 2010 when the well was capped.

BP, found guilty of “Gross Negligence” and “Willful Misconduct” in the Deepwater Horizon oil spill, (BBC, EcoWatch), has agreed to pay $18.7 Billion over the next 15 years (BP Press Release, Reuters) to settle various claims with the United States, the states of Florida, Alabama, Mississippi, Louisiana and Texas, and others.  This amounts to 14.8% of BP’s current market capitalization.

Pursuant to the agreements, BP will pay $1.1 Billion per year over the next 15 years. While the $18.7 Billion amounts to 14.8% of BP’s current market capitalization of $125.59 Billion, the $1.1 Billion per year is only a loss of 0.88% of BP’s current market capitalization each year.

However,

Continue reading

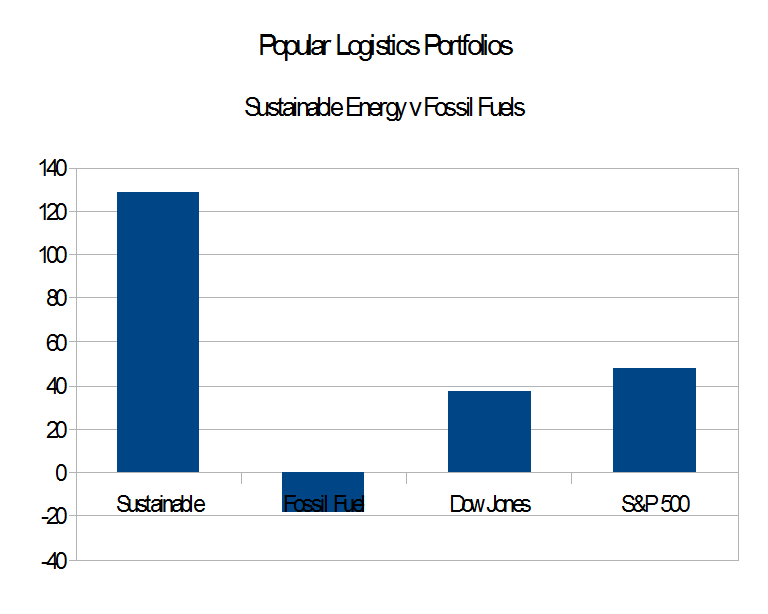
Energy Portfolios, 2 1/2 years Sustainable Energy Up 128%, Fossil Fuel DOWN 18.2%

PLPort.2015.6.21On Dec. 21, 2012, I put $16 Million imaginary dollars in equal imaginary investments in 16 real energy companies; $8.0 in the Sustainable Energy space and $8.0 in the fossil fuel space. Excluding the value of dividends and transaction costs, but including the bankruptcy or crash of three companies in the sustainable energy space,

  • The Fossil Fuel portfolio is now worth $6.54 Million, down 18.24%.
  • The Sustainable Energy portfolio is now worth $18.259 Million, up 128.24%.
  • The Dow Jones Industrial Average is up 37.6%, from 13,091 on 12/21/12 to 18,061 on 6/20/15.
  • The S&P 500 is up 47.55%, from 1,430 to 2,110.
  • The Energy Portfolios and the Indices are down in the last month.

Continue reading

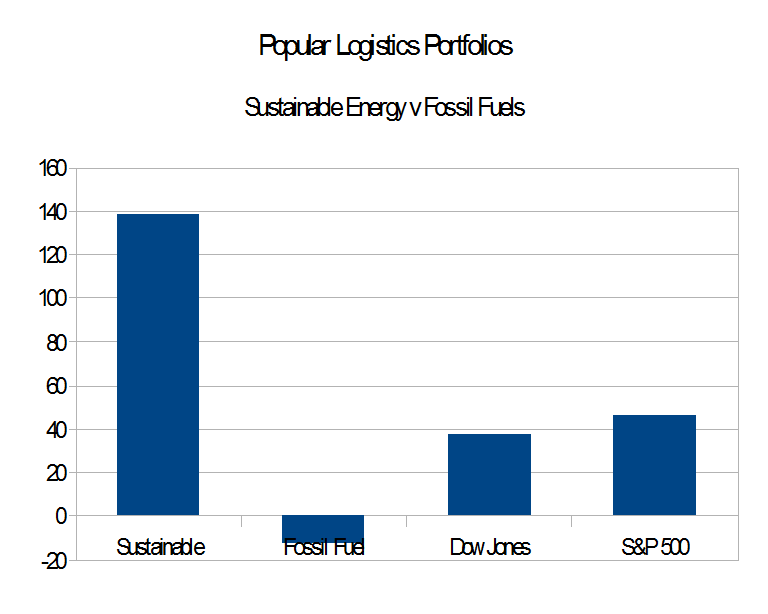
Energy Portfolios, 2 years 5 Months: Sustainable Energy Up 137%, Fossil Fuel DOWN 13.7%

PLPort.1505On Dec. 21, 2012, I put $16 Million imaginary dollars in equal imaginary investments in 16 real energy companies; $8.0 in the Sustainable Energy space and $8.0 in the fossil fuel space. Excluding the value of dividends and transaction costs, but including the bankruptcy or crash of three companies in the sustainable energy space.

  • The Fossil Fuel portfolio is now worth $6.95 Million, down 13.1%.
  • The Sustainable Energy portfolio is now worth $18.98 Million, up 137.3%.
  • Both Fossil Fuel and Sustainable Energy are down slightly in the last month.
  • The Dow Jones Industrial Average is up 39.7%, from 13,091 on 12/21/12 to close at 18,286 on 5/21/15.
  • The S&P 500 is up 49%, from 1,430 to 2,131.

Continue reading

Energy Portfolios, 2 years 4 Months: Sustainable Energy up 138%, Fossil Fuel DOWN 12%

PLPort.2015.4.21

On Dec. 21, 2012, I put $16 Million imaginary dollars in equal imaginary investments in 16 real energy companies; $8.0 in the Sustainable Energy space and $8.0 in the fossil fuel space. Excluding the value of dividends and transaction costs, but including the bankruptcy or crash of three companies in the sustainable energy space,

  • The Fossil Fuel portfolio is now worth $7.0 Million, down 12.1%.
  • The Sustainable Energy portfolio is now worth $19.0 Million, up 138.1%.
  • The Dow Jones Industrial Average is up 37.1%, from 13,091 to 17,950.
  • The S&P 500 is up 46.6%, from 1,430 to 2,097.

The conclusion appears to be that sustainable energy is as good for the portfolio as it is for the planet.

Continue reading

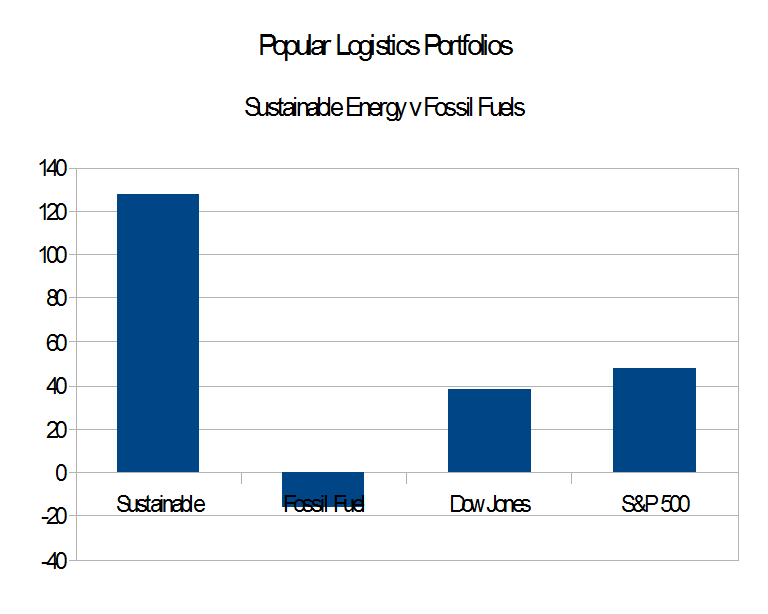
Energy Portfolios, 2 Years 3 Months: Sustainable Energy: UP 128%, Fossil Fuels: DOWN 16%

PLPort.2015.3.21

On Dec. 21, 2012, I put $16 Million imaginary dollars in equal imaginary investments in 16 real energy companies; $8.0 in the Sustainable Energy space and $8.0 in the Fossil Fuel space. The pattern, clear by March, 2013, is the Sustainable Energy Space is outperforming and the Fossil Fuel space is underperforming the indices.

Excluding the value of dividends and transaction costs,

  • The Fossil Fuel portfolio is now worth $6.7 Million, down 16.07%.
  • The Sustainable Energy portfolio is now worth $18.2 Million, up 127.62%.
  • The Dow Jones Industrial Average is up 38.47%, from 13,091 on 12/21/12 to 18,209 on 3/20/15
  • The S&P 500 is up 47.42%, from 1,430 to 2,108.

Continue reading

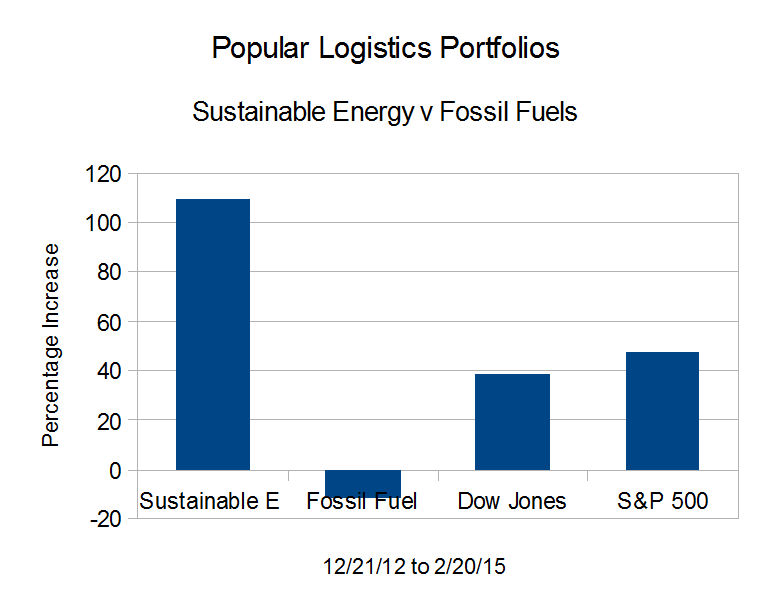
Energy Portfolios, 2 years 2 Months: Sustainable Energy up 109%, Fossil Fuel DOWN 11.8%

PopLogPort.150221
On Dec. 21, 2012, I put $16 Million imaginary dollars in equal imaginary investments in 16 real energy companies; $8.0 in the Sustainable Energy space and $8.0 in the fossil fuel space. Excluding the value of dividends and transaction costs,

  • Fossil Fuel portfolio: from $8.0 M to $7.06 Million, down 11.76%.
  • Sustainable Energy portfolio: from $8.0 M to $16.73 Million, up 109.18%.
  • Dow Jones Industrial Average: from 13,091 to 18,140, up 34.15 %,
  • The S&P 500: from 1,430 to 2,110,  up 42.10%.

Continue reading

If Not Vaccines, What Triggers Autism?

Humphrey Bogart and Ingrid Bergman in Casablanca, 1943

Humphrey Bogart as Rick and Ingrid Bergman as Ilsa in Casablanca, 1942

“Of all the gin joints in all the towns in all the world, she walks into mine” – “Casablanca.

Once rare, the incidence of Autism has increased exponentially from less than 0.02% of boys to 2.38%.

Before the MMR Vaccine: 400 to 500 died each year as Millions contracted the disease. Due to widespread administration of the vaccine, the incidence of Measles dropped to 37 reported cases in 2004.  But because people believe (falsely) that the MMR vaccine triggers Autism, they stopped immunizing their children. There were 644 cases of Measles in 2014.

If the MMR Vaccine does not trigger Autism, what does?  Glyphosate? Possibly. And what’s Glyphosate? The active ingredient in Monsanto’s Roundup.

This is a story of unintended consequences.

Continue reading