Category Archives: Sustainabilty

What’s Good for America is Good for GM

Dwight D. Eisenhower c1952 Copyright by Fabian Bachrach.

In 1953 President Eisenhower nominated Charles Wilson to be his Secretary of Defense. Wilson, then the President of General Motors, had overseen GM’s war production during World War II. During his confirmation hearings he was asked if he could make a decision that was bad for GM. His response is remembered as a classic example of arrogance – “What’s good for GM is good for America.”

However, that’s not exactly what he said.

Continue reading

Tesla, the Auto Industry, and the Oil Industry, Nov. 2021

Tesla, with a market capitalization of $1.137 Trillion at the close of trading on Friday, November 19, 2021, is worth more than GM, Ford, Honda, Toyota, BMW, Daimler Benz, VW COMBINED. 45% more.

Add in the value of Nisan, Hyundai, and Stellantis, which owns Fiat, Chrysler, Jeep, Maserati, Alfa Romeo, and other brands, and Tesla is still worth 25.8 % more than the rest of the major auto companies. See Table 1.

More surprising is that Tesla, is worth 39% more than Exxon Mobil, Shell, Conoco Philips, Chevron Texaco, and BP Amoco combined. See Table 2.

Arguably, Toyota set the stage for energy efficiency with the 1997 launch of the Prius (click here). And Fisker, launched in 2007, could have been Tesla. Coupled with the fact that other car companies are introducing electric vehicles, including the Chevy Bolt, the Ford Mustang Mach-e and the Ford F-150 Lightning, the Fisker Ocean, etc. it is clear that with Tesla, Elon Musk has changed the world.

Continue reading

Energy Portfolios, 8 Years, 8 Months: Sustainable Energy Up 78.3%, Fossil Fuel DOWN 48.8%

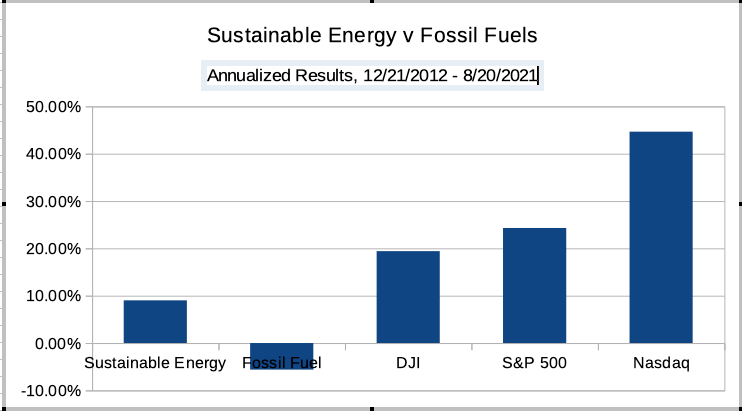
On Dec. 21, 2012, I put $16 Million imaginary dollars into 16 real energy companies; $8.0 in the Sustainable Energy space and $8.0 in the fossil fuel space, $1.0 Million into each. Excluding the value of dividends and transaction costs, but including the bankruptcy or crash of three companies in the sustainable energy space, as of the close of trading on 8/20/21, eight (8) years and eight (8) months later

The Sustainable Energy companies have increased dramatically in value, the Fossil Fuel companies have decreased in value.

Continue reading

Energy Portfolios, 4 Years, 11 Months: Sustainable Energy Up 108.6%, Fossil Fuel DOWN 24.3%

On Dec. 21, 2012, I put $16 Million imaginary dollars into 16 real energy companies; $8.0 in the Sustainable Energy space and $8.0 in the fossil fuel space, $1.0 Million into each. Excluding the value of dividends and transaction costs, but including the bankruptcy or crash of three companies in the sustainable energy space,

In recent months the Sustainable Energy portfolio has dropped and the Fossil Fuel portfolio has increased. However, this may prove to be a short term correction that has more to do with macro-geopolitical events emanating from Washington, DC than global macroeconomic factors.    

As of the close of trading 59 months later,

  • The Market Capitalization of the sustainable energy companies is up 148.6%, from $39.58 Billion to $98.4 Billion. (See Table 6, below).
  • The Market Capitalization of the Fossil Fuel portfolio is DOWN 3.8%, from $1.09 Trillion to $1.05 Trillion. (See Table 7, below).
  • And the Market Capitalization of the Big Oil companies is DOWN 2.6%,from $1.03 Trillion on 9/21/17 to $1.007 Trillion on 10/20/17. (See Table 8, below)

In Addition

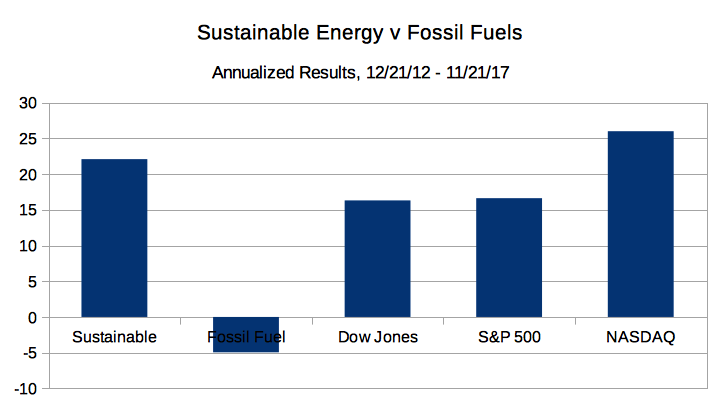
  • The Fossil Fuel portfolio went from $8.0 Million to $6.06 Million, down 24.3% overall, down 4.94% on an annualized basis.
  • The Sustainable Energy portfolio went from $8 Million to $16.7 Million, up 108.6%, overall and 22.1% on an annualized basis.
  • The Dow Jones Industrial Average is up 80.2% overall and 16.31% on an annualized basis; from 13,091 on 12/21/12 to 23,591 on 11/21/17.
  • The S&P 500 is up 81.8% overall and 16.63% on an annualized basis, from 1,430 on 12/21/12 to close at 2,599 on 11/21/17.

The details are below.

Continue reading

Energy Portfolios, 4 Years, 8 Months: Sustainable Energy Up 161.6%, Fossil Fuel DOWN 32.1%

On Dec. 21, 2012, I put $16 Million imaginary dollars into 16 real energy companies; $8.0 in the Sustainable Energy space and $8.0 in the fossil fuel space, $1.0 Million into each. Excluding the value of dividends and transaction costs, but including the bankruptcy or crash of three companies in the sustainable energy space,

As of the close of trading 56 months later:

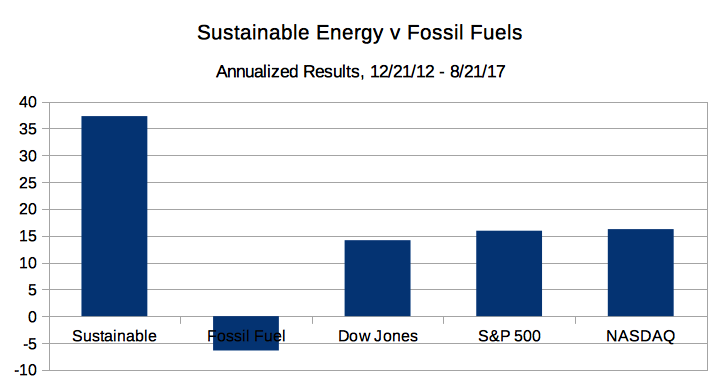
  • The Market Capitalization of the sustainable energy companies is up 150.44%, from $39.58 Billion to $99.12 Billion. (See Table 6, below).
  • The Market Capitalization of the Fossil Fuel portfolio is DOWN 12.93%, from $1.099 Trillion to $948.38 Trillion. (See Tables 7, below).
  • And the Market Capitalization of the Big Oil companies, BP, Chevron, Conoco Philips, Exxon and Shell is down 11.84%, from $1.034 Trillion on 12/21/12 to $911.8 Billion on 8/21/17. (See Table 8, below).

Continue reading

Energy Portfolios, 4 Years, 7 Months: Sustainable Energy Up 170.8%, Fossil Fuel DOWN 29.3%

On Dec. 21, 2012, I put $16 Million imaginary dollars into 16 real energy companies; $1.0 Million into each of eight sustainable energy companies and $1.0 Million into each of eight fossil fuel companies. Excluding the value of dividends and transaction costs, but including the bankruptcy or crash of various companies, as of the close of trading 55 months later,

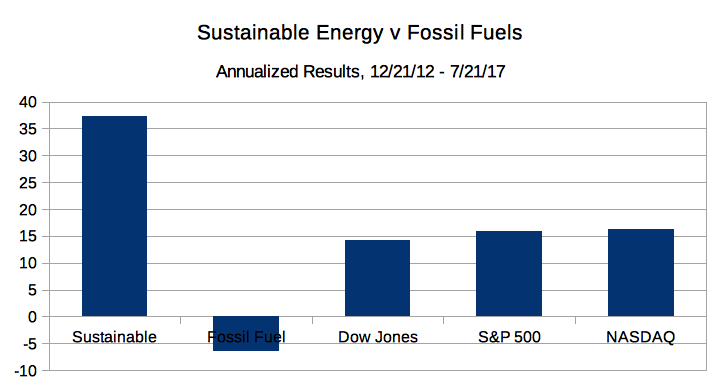
  • The Market Capitalization of the sustainable energy companies is up 140.6%, from $39.58 Billion to $99.2 Billion. (See Table 6, below).
  • The Market Capitalization of the Fossil Fuel portfolio is DOWN 11.99%, from $1.09 Trillion to $968.6 Billion. (See Tables 7 & 8, below).

Continue reading

Energy Portfolios: 4 Years, 1 Month: Sustainable Energy Doubled, Fossil Fuel Down 18%

Port.1701_html_m4ee8b1d2

Back in December, 2012 I started this experiment in sustainable investing. I took $16 million imaginary dollars and invested them, in imaginary $1.0 Million chunks, in 8 sustainable energy companies and 8 fossil fuel companies. The results are:

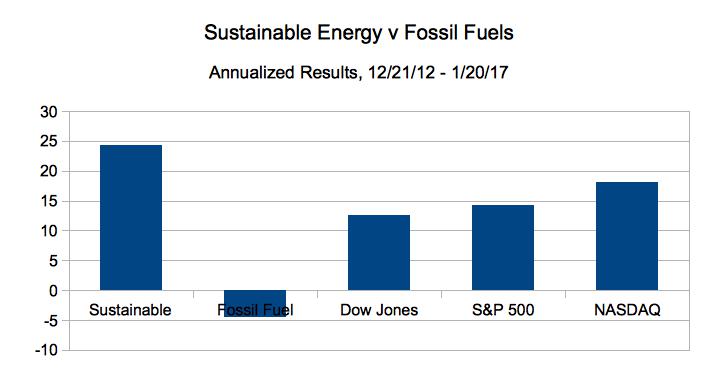
  • The Fossil Fuel portfolio is down 18.29% overall, from $8.0 Million to $6.54 Million. This is a collapse of -4.48% on an annualized basis. However, please note that my model does not account for dividends.
  • The Market Capitalization of the five big oil companies of the Fossil Fuel portfolio has decreased by 4.95%
  • The Sustainable Energy portfolio has essentially doubled in stock price since Dec. 2012. Up 98.98% overall and 24.24% on an annualized basis, from $8 Million to $15.92 Million.
  • The Market Capitalization of the Sustainable Energy portfolio has increased by 87.21% in this period.
  • The Dow Jones Industrial Average is up 51.43% overall and 12.60% on an annualized basis from 13.091 on Dec. 21, 2012 to 19,824 on Jan. 20, 2017.
  • The S&P 500 is up 57.97% overall and 14.20% on an annualized basis, from 1,430 to 2,259.
  • The NASDAQ is up 74.54% overall and 18.20% on an annualized basis, from 3,021 to 5,251.

Continue reading

Energy Portfolios 4 Years: Sustainable Energy Up 87%, Fossil Fuel DOWN 18%

pop-log-port-4-yrs

As of the close of trading on December 21, 2016:

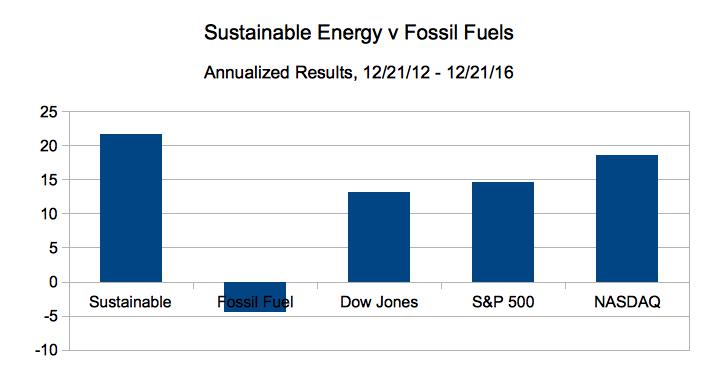
  • The Fossil Fuel portfolio is up to a point where it is only down 18% overall, from $8.0 Million to $6.56 Million. This is a collapse of -4.5% on an annualized basis.
  • The Sustainable Energy portfolio is up 86.75% overall and 21.69% on an annualized basis, from $8 Million to $14.94 Million.
  • The Dow Jones Industrial Average is up 52.33% overall and 13.1% on an annualized basis from 13.091 on Dec. 21, 2012 to 19,942 on Dec. 21, 2016.
  • The S&P 500 is up 58.38% overall and 14.6% on an annualized basis, from 1,430 to 2,265.
  • The NASDAQ is up 74.54% overall and 18.6% on an annualized basis, from 3,021 to 5,257.

Continue reading

Energy Portfolios: 3 Years, 11 Months: Sustainable Energy Up 93%, Fossil Fuel DOWN 20%

plp-16-11_html_m3215ec2cAs of the close of trading on November 21, 2016:
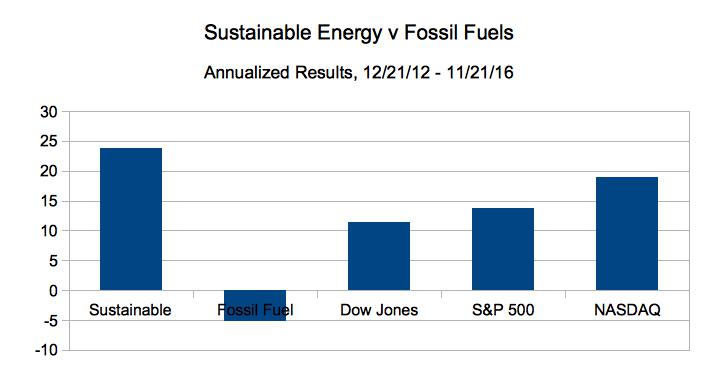
  • The Fossil Fuel portfolio is down 26% overall, down 6.8% on an annualized basis, from $8.0 Million to $6.4 Million, but is up 10% from $5.9 Million on Oct. 21, 2016.
  • This is a collapse of -5% on an annualized basis.
  • The Sustainable Energy portfolio is up 93.0% overall and 24% on an annualized basis, from $8 Million to $15.5 Million, and is down $2.9 Million from Oct. 21, 2016.
  • These recent fluctuations are probably due in part, to the election of Donald Trump.
  • The Dow Jones Industrial Average is up 44.8% overall and 11.4% on an annualized basis from 13.091 on Dec. 21, 2012 to 18,957 on Nov. 21, 2016.
  • The S&P 500 is up 53.7% overall and 13.7% on an annualized basis, from 1,430 to 2,198.
  • The NASDAQ is up 77.7% overall and 19.84% on an annualized basis, from 3,021 to 5,369.

Continue reading

Energy Portfolios, 3 Years, 1 Month: Sustainable Energy Up 135.6, Fossil Fuel DOWN 42.8%

PLPort.1601Wall St. 1/21/16. On Dec. 21, 2012, I put $16 Million imaginary dollars in equal imaginary investments in 16 real energy companies; $8.0 in the Sustainable Energy space and $8.0 in the fossil fuel space.
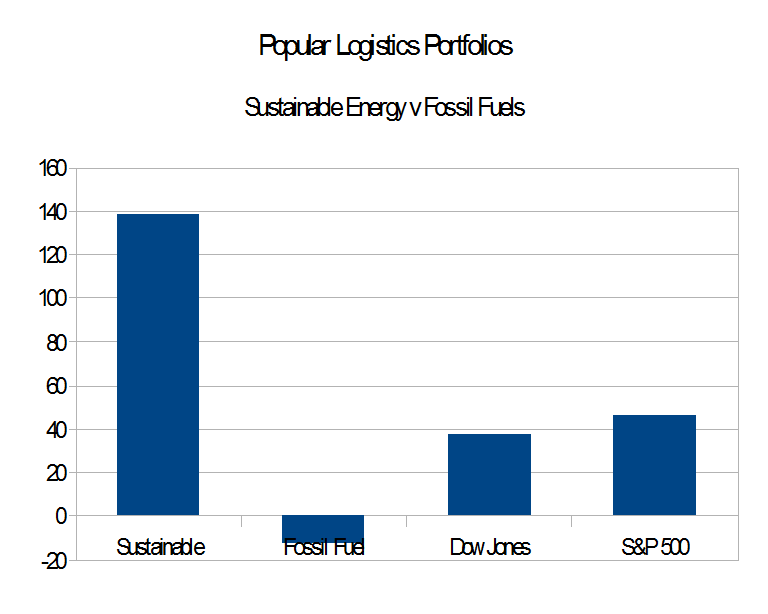
Today it is worth an imaginary $23.48 Million because while the Fossil Fuel portfolio dropped 42.8% of it’s total value, the Sustainable Energy portfolio increased 135.6%.

This excludes the value of dividends and transaction costs, but includes the bankruptcy or crash of three companies in the sustainable energy space.

This month’s post was delayed due to preparations for and digging out from Blizzard Jonas.

Continue reading

Energy Portfolios, 2 Years 11 Months: Sustainable Energy Up 129.5%, Fossil Fuel DOWN 29.6%

PLPort.1511On Dec. 21, 2012, I put $16 Million imaginary dollars in equal imaginary investments in 16 real energy companies; $8.0 in the Sustainable Energy space and $8.0 in the fossil fuel space. Excluding the value of dividends and transaction costs, but including the bankruptcy or crash of three companies in the sustainable energy space,
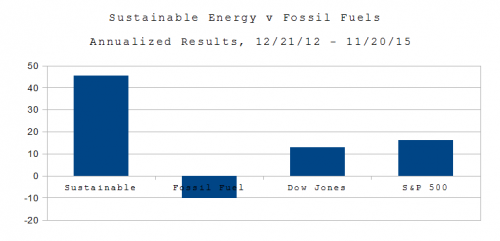
As of the close of trading on November 20, 2015:

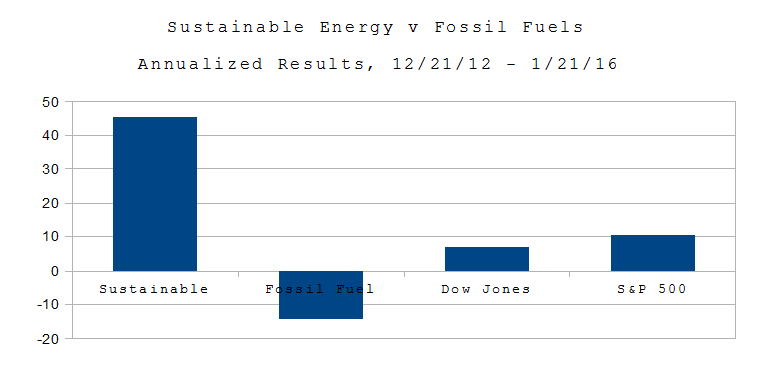
  • The Fossil Fuel portfolio was worth $5.63 Million, down 29.57% overall, down 10.44% on an annualized basis.
  • The Sustainable Energy portfolio was worth $18.0 Million, up 129.50%, overall and 45.71% on an annualized basis.
  • The Dow Jones Industrial Average is up 36.15% overall and 10.44% on an annualized basis, from 13,091 on 12/21/12 to close at 17,824 on 10/21/15.
  • The S&P 500 is up 46.10% overall and 16.27% on an annualized basis, from 1,430 on 12/21/12 to close at 2,089 on 10/21/15.

It’s not a war on coal. It’s a paradigm shift.Think about it. We don’t use whale oil or kerosene for street lamps. We did, 100 years ago.

This of course, has geopolitical ramifications. It’s not just carbon dioxide, which is changing the climate and acidifying the oceans. Like Al Queda, Hamas and Hezbollah, ISIS finances its operations with petrodollars. (The difference is that Hamas is supported by Emirates and Kuwait, Hezbollah by Iran, Al Queda by our friends the Saudis, while ISIS has its own oil wells.) Earlier this year NJ’s Honorable Governor Chris Christie, a candidate for President, gave Exxon a $9 Billion gift (which is being challenged in the courts). BP was the beneficiary of the 1953 coup by the US under President Eisenhower and the UK which toppled the democratically elected government led by Prime Minister Mohammed Mossagedgh of Iran and propped up the Shah until the revolution in 1979.  Shell has spent something like $12 Billion in failed attempts to drill the Arctic. BP, Transocean and Halliburton brought us the Deepwater Horizon; Halliburton also profited from the US Led war in Iraq.

Continue reading

Energy Portfolios, 2 years 4 Months: Sustainable Energy up 138%, Fossil Fuel DOWN 12%

PLPort.2015.4.21

On Dec. 21, 2012, I put $16 Million imaginary dollars in equal imaginary investments in 16 real energy companies; $8.0 in the Sustainable Energy space and $8.0 in the fossil fuel space. Excluding the value of dividends and transaction costs, but including the bankruptcy or crash of three companies in the sustainable energy space,

  • The Fossil Fuel portfolio is now worth $7.0 Million, down 12.1%.
  • The Sustainable Energy portfolio is now worth $19.0 Million, up 138.1%.
  • The Dow Jones Industrial Average is up 37.1%, from 13,091 to 17,950.
  • The S&P 500 is up 46.6%, from 1,430 to 2,097.

The conclusion appears to be that sustainable energy is as good for the portfolio as it is for the planet.

Continue reading

Energy Portfolios, 18 Months, Analysis

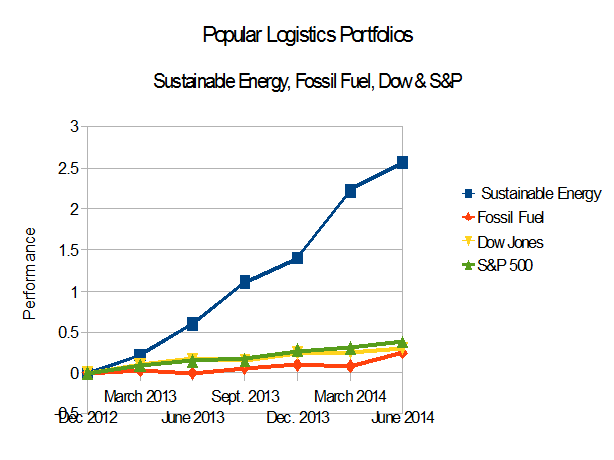
EnergyPortfolios_Indices_2014_06 We are watching a paradigm shift.

How else can we explain the dramatic rise of the Sustainable Energy portfolio, the equally dramatic underperformance of the Fossil Fuel portfolio, compared to the Dow Industrials and the S&P 500 since I started this experiment on Dec. 21, 2012? The data are in my post of June 24, 2014, Energy Portfolios, 18 Months: Sustainable up 257%, Fossil Fuels up 24.6%.

Consider these questions:

  1. Which companies are Disruptive or Subject to Disruption?
  2. Which companies are Evolving and which are doing what worked for the last 20/30/50/80 years?
  3. Can management execute?
  4. Is management asking for government subsidies?
  5. What about the long term side effects? What are the Economic Externalities?

Continue reading

Energy Portfolios: 15 Months: Sustainable up 222.6%: Fossil Fuel up 7.3%

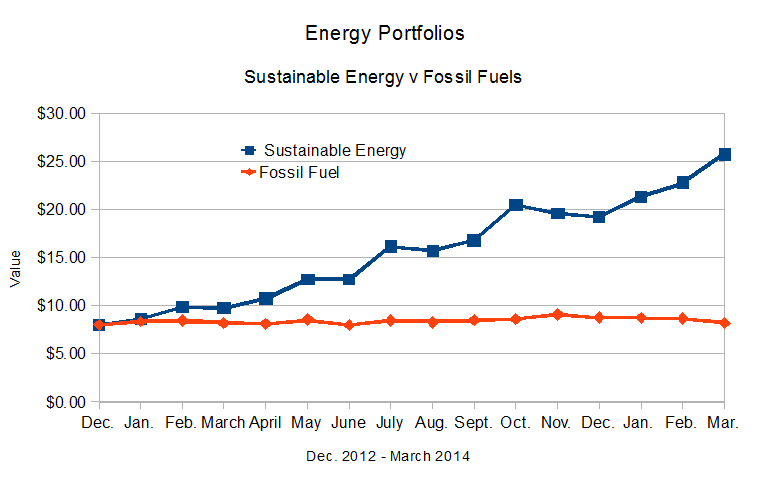
Line graph showing valuations of Sustainable and Fossil Fuel Energy Portfolios, not corrected for dividend distributions

On Dec. 21, 2012, I put $16 Million imaginary dollars in equal imaginary investments in 16 real energy companies; Eight in the Sustainable Energy space and eight in the fossil fuel space. The Sustainable Energy portfolio is composed of Cree and Lighting Sciences in the LED space, GTAT, which at the time made solar ovens for cooking PV wafers, and today is diversifying, First Solar and Sunpower in the solar space, Vestas, a wind company, Solazyme a biofuel company and Next Era, a utility. The fossil fuel companies are the oil companies BP, Chevron Texaco, Conoco Phillips, Exxon Mobil and RD Shell, the coal company Peabody Coal, and Haliburton and Transocean, companies in the offshore oil and oil and gas drilling service industries.

Continue reading

Energy Portfolios: Minor Corrections, Overall Results In Line with the Trend

PlPort_2013_11On Dec. 21, 2011, with $16 Imaginary Million, I created an investment simulation. I invested $1.0 Million in imaginary money in each of eight fossil fuel companies and eight sustainable energy companies. As of the close of trading 11 months later, Friday, Nov. 22, 2013, the trend, clearly evident after three months, in March of this year, continues.

  • The Dow Jones Industrial Average is up 22.72% from 12/21/12.
  • The S&P 500 is up 26.22%.
  • The Fossil Fuel Portfolio, dramatically underperforming the reference indices, is up 13.37% from Dec. 21, 2012.
  • The Sustainable Energy portfolio is up 145.37% from Dec. 21, 2012.
  • The Sustainable Energy Portfolio is also down 4.39% from October 18, 2013.

Note  that this represents a retreat of 4.39% from the high of 156.14%, in October, 2013.

As discussed in September and October, last month, in Septermber, 2013, in “Investing for the Future,” and October, in “Sustainable Investing: Green Energy, Green Economy,” the important question is:  Is this a trend or a bubble?  As I wrote, I think it’s a trend.

The 2,000 pound question, after Typhoon Haiyon, Hurricanes Sandy,  Irene and Katrina, after the fires of 2012 and 2013, the Missouri River Floods of 2011 – which knocked out the Fort Calhoun nuclear plant – the super-tornadoes of 2013 – one with a two mile wide contact point on land, which tore through Oklahoma (CNN / National Geographic / Zerohedge) is will we survive to make the transition to clean sustainable energy?

or rather:

  1. “How many of us survive to make this transition?”
  2. “What will be the carrying capacity of earth for humans?”

The data are summarized beginning in Table 1, below.

Continue reading