 On Dec. 21, 2012, I put $16 Million imaginary dollars in equal imaginary investments in 16 real energy companies; Eight in the Sustainable Energy space and eight in the fossil fuel space. In the 18 months between the close of trading December 21, 2012 and the close of trading June 20, 2014,
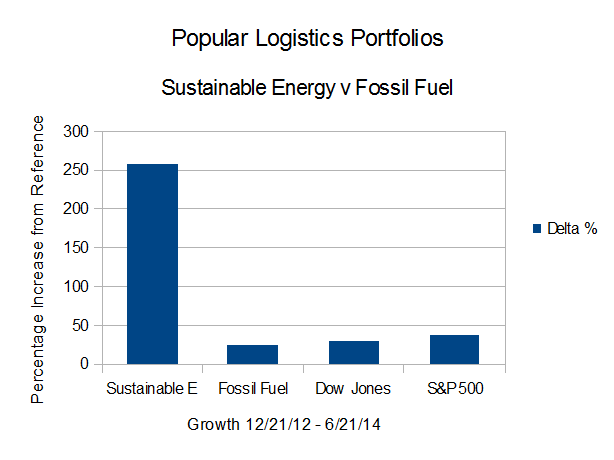
- The Dow Jones Industrial Average is up 29.46% from 12/21/12.
- The S&P 500 is up 37.27%.
- The Fossil Fuel Portfolio is up 24.56% from Dec. 21, 2012.
- The Sustainable Energy portfolio is up 257.06% from Dec. 21, 2012.
In addition to the data summary, below, this post, the 21st in the series, will be followed with a summary analysis.
The Sustainable Energy portfolio is composed of Cree and Lighting Sciences in the LED space, GTAT, which in Dec. 2012 focused on ovens for cooking PV wafers, and today is diversifying, First Solar and Sunpower in the solar space, Vestas, a wind company, Solazyme, a biofuel company and Next Era, a utility. The fossil fuel companies are the oil companies BP, Chevron Texaco, Conoco Phillips, Exxon Mobil and Royal Dutch Shell, the coal company Peabody Energy, and Haliburton and Transocean, companies in the offshore oil and oil and gas drilling service industries. I did not include Tesla and Solar City in the sustainable energy space, or PSE&G, Valero, Hess, Sunoco, Gazprom in the Fossil Fuel portfolio, or expand it to include Entergy, Exelon, and other companies in the nuclear energy space.
The data are summarized beginning in Table 1, below.
| Summary Data | ||||
| Portfolio | 12/21/12 | 06/21/14 | Delta | % |
| Sustainable Energy | 8,000,000 | 28,564,875 | 20,564,875 | 257.06% |
| Fossil Fuel | 8,000,000 | 10,006,458 | 2,006,458 | 25.08% |
| DJI | 13,091 | 16,947 | 3,856 | 29.46% |
| S&P 500 | 1,430 | 1,963 | 533 | 37.27% |
| Table 1 | ||||
The stock price data for the Sustainable Energy portfolio are in Table 2, below.
| Sustainable Energy Portfolio – Stock Prices | ||||||
| Item | Company | Symbol | 12/21/12 | 06/21/14 | Delta | Delta % |
| 1 | Cree | CREE | 34.0 | 48.8 | 14.77 | 43.44% |
| 2 | First Solar | FSLR | 31.0 | 68.9 | 37.90 | 122.26% |
| 3 | GT Adv. Tech. | GTAT | 3.0 | 18.3 | 15.30 | 510.00% |
| 4 | Lighting Science | LSCG | 0.8 | 0.4 | -0.39 | -52.53% |
| 5 | Next Era Energy | NEE | 70.0 | 100.0 | 29.99 | 42.84% |
| 6 | Sun Power | SPWR | 5.4 | 40.3 | 34.84 | 641.62% |
| 7 | Solazyme | SZYM | 8.3 | 11.8 | 3.48 | 41.73% |
| 8 | Vestas | VWS | 6.3 | 50.9 | 44.62 | 707.13% |
| Table 2 | ||||||
The stock price data for the Sustainable Energy portfolio, with the addition of Tesla and Solar City are in Table 2a, below.
| Sustainable Energy Portfolio – Plus Solar City and Tesla – Stock Prices | ||||||
| Item | Company | Symbol | 12/21/12 | 06/21/14 | Delta | Delta % |
| 1 – 8 | ||||||
| 9 | Solar City | SCTY | 10.73 | 69 | 58.27 | 543.06% |
| 10 | Tesla Motors | TSLA | 34 | 229.59 | 195.59 | 575.26% |
| Table 2a | ||||||
The stock price data for the Fossil Fuel Portfolio are in Table 3, below.
| Fossil Fuel Portfolio – Stock Prices | ||||||
| Item | Company | Symbol | 12/21/12 | 06/21/14 | Delta | Delta % |
| 1 | BP | BP | 42.1 | 52.8 | 10.66 | 25.31% |
| 2 | Chevron Texaco | CVX | 109.7 | 132.3 | 22.63 | 20.63% |
| 3 | Conoco Philips | COP | 58.6 | 85.4 | 26.76 | 45.67% |
| 4 | Exxon Mobil | XOM | 87.2 | 103.8 | 16.60 | 19.03% |
| 5 | Royal Dutch Shell | RDS.A | 69.3 | 82.4 | 13.06 | 18.85% |
| 6 | Haliburton | HAL | 34.7 | 70.2 | 35.53 | 102.36% |
| 7 | Transocean | RIG | 45.6 | 45.4 | -0.26 | -0.57% |
| 8 | Peabody Coal | BTU | 26.4 | 17.0 | -9.40 | -35.67% |
| Table 3 | ||||||
The valuation data for the Sustainable Energy Portfolio are in Table 4, below.
| Sustainable Energy Portfolio – Valuation | ||||||
| Value | Delta | |||||
| Item | Company | Symbol | 12/21/12 | 06/21/14 | Delta | Delta % |
| 1 | Cree | CREE | 1,000 | 1,434 | 434 | 43.44% |
| 2 | First Solar | FSLR | 1,000 | 2,223 | 1,223 | 122.26% |
| 3 | GT Adv. Tech. | GTAT | 1,000 | 6,100 | 5,100 | 510.00% |
| 4 | Lighting Science | LSCG | 1,000 | 475 | -525 | -52.53% |
| 5 | Next Era Energy | NEE | 1,000 | 1,428 | 428 | 42.84% |
| 6 | Sun Power | SPWR | 1,000 | 7,416 | 6,416 | 641.62% |
| 7 | Solazyme | SZYM | 1,000 | 1,417 | 417 | 41.73% |
| 8 | Vestas | VWS | 1,000 | 8,071 | 7,071 | 707.13% |
| total | 8,000 | 28,565 | 20,565 | 257.06% | ||
| Note that the values are in thousands. | ||||||
| Table 4 | ||||||
The valuation data for the Sustainable Energy Portfolio, plus Solar City and Tesla Motors are in Table 4a, below.
| Sustainable Energy Portfolio – Valuation | ||||||
| Value | Delta | |||||
| Item | Company | Symbol | 12/21/12 | 06/21/14 | Delta | Delta % |
| 1 – 8 | total | 8,000 | 28,565 | 20,565 | 257.06% | |
| 9 | Solar City | SCTY | 1,000 | 6,431 | 5,431 | 543.06% |
| 10 | Tesla Motors | TSLA | 1,000 | 6,753 | 5,753 | 575.26% |
| Total | 10,000 | 41,748 | 31,748 | 317.48% | ||
| Note that the values are in thousands. | ||||||
| Table 4a | ||||||
The valuation data for the Fossil Fuel Portfolio are in Table 5, below.
| Fossil Fuel Portfolio – Valuations | ||||||
| Value | Delta | |||||
| Item | Company | Symbol | 12/21/12 | 06/21/14 | Amount | Per Cent |
| 1 | BP | BP | 1,000 | 1,253 | 253 | 25.31% |
| 2 | Chevron Texaco | CVX | 1,000 | 1,206 | 206 | 20.63% |
| 3 | Conoco Philips | COP | 1,000 | 1,457 | 457 | 45.67% |
| 4 | Exxon Mobil | XOM | 1,000 | 1,190 | 190 | 19.03% |
| 5 | Royal Dutch Shell | RDS.A | 1,000 | 1,188 | 188 | 18.85% |
| 6 | Haliburton | HAL | 1,000 | 2,024 | 1,024 | 102.36% |
| 7 | Transocean | RIG | 1,000 | 994 | -6 | -0.57% |
| 8 | Peabody Coal | BTU | 1,000 | 652 | -348 | -34.81% |
| total | 8,000 | 9,965 | 1,965 | 24.56% | ||
| Note that the values are in thousands. | ||||||
| Table 5 | ||||||
The market capitalization data for the Sustainable Energy Portfolio are in Table 6, below.
| Sustainable Energy Portfolio | ||
| Market Capitalization | ||
| Item | Company | Market Cap |
| 1 | Cree | 8.8 |
| 2 | First Solar | 5.2 |
| 3 | GT Adv. Tech. | 1.1 |
| 4 | Lighting Science | 0.1 |
| 5 | Next Era Energy | 35.6 |
| 6 | Sun Power | 3.1 |
| 7 | Solazyme | 0.7 |
| 8 | Vestas | 5.8 |
| total | 60.39 | |
| Table 6 | ||
The market capitalization data for the Sustainable Energy Portfolio, plus Solar City and Tesla Motors are in Table 6a, below.
| Sustainable Energy Portfolio | ||
| Market Capitalization | ||
| Item | Company | Market Cap |
| 1 – 8 | Sustainable E | 60.39 |
| 9 | Solar City | 6.53 |
| 10 | Tesla Motors | 26.7 |
| total | 93.62 | |
| Table 6a | ||
The market capitalization data for the Fossil Fuel Portfolio are in Table 7, below.
| Fossil Fuel Portfolio | ||
| Market Capitalization | ||
| Item | Company | Market Cap |
| 1 | BP | 137.1 |
| 2 | Chevron Texaco | 231.5 |
| 3 | Conoco Philips | 89.3 |
| 4 | Exxon Mobil | 383.4 |
| 5 | Royal Dutch Shell | 211.8 |
| 6 | Haliburton | 50.7 |
| 7 | Transocean | 16.8 |
| 8 | Peabody Coal | 5.1 |
| total | 1125.7 | |
| Table 7 | ||
–
Posts in this series
- L. Furman, 12/21/12, Popular Logistics Sustainable Energy Portfolio,
- L. Furman, 2/8/13, Nega-Watts, Nega-Fuel-Watts, Mega-Bucks,
- L. Furman, 2/9/13, Gold Bricks and Sink-Holes – The Risk & Reward of Fossil Fuel, Solar & Wind,
- L. Furman, 3/2/13, Sustainable Energy Portfolio UP 16% & Fossil Fuel Portfolio Up 1.7% – Since Dec.21, 2012..
- L. Furman, 3/23/13, Portfolio Simulation At 3 Months: Sustainable Energy: Up 22%. Fossil Fuels: 3%.
- L. Furman, 4/26/13, Earth Day, 2013. Oil Spills, Explosions, Fracking Business As Usual & The Stock Market Response
- L. Furman, 5/13/13, Popular Logistics Energy Portfolios: The Trend Continues.
- L. Furman, 6/24/13, Popular Logistics Energy Portfolios: At 6 months
- L. Furman, 7/22/13, Popular Logistics Energy Portfolios: Sustainable Energy Doubles. Fossil Fuels increase 5.4%
- L. Furman, 8/22/13, Popular Logistics Energy Portfolios: An Exercise in Climate Capitalism
- L. Furman, 9/20/13, Energy Portfolios – Investing for the Future
- L. Furman, 10/21/13, Sustainable Investing – Green Energy, Green Economy
- L. Furman, 11/22/13, Energy Portfolios: Minor Corrections, Overall Results In Line With the Trend
- L. Furman, 12/23/13, Energy Portfolios at One Year Sustainable Energy up 140%. Fossil Fuels up 9.85%.
- L. Furman, 12/26/13, Energy Portfolios and Reference Indices, 2013 Summary.
- L. Furman, 1/22/14, Energy Portfolios: 13 Months, Sustainable Energy up 167.4%, Fossil Fuels up 9.44%.
- L. Furman, 2/24/14, Energy Portfolios: 14 Months: Sustainable Energy up 184.4%, Fossil Fuels up 8.7%
- L. Furman, 3/23/14, Energy Portfolios: 15 Months: Sustainable Energy up 222.6, Fossil Fuel up 7.3%
- L. Furman, 4/22/14, Energy Portfolios, 16 Months: Sustainable Energy up 204.25%, Fossil Fuel up 15.38%
- L. Furman, 5/21/14, Energy Portfolios, 17 Months: Sustainable Energy up 211.6%, Fossil Fuels up 18.5%
- L. Furman, 6/24/14, Energy Portfolios, 18 Months: Sustainable Energy up 257%, Fossil Fuels up 24.6%
–
I, Larry Furman, an analyst with Popular Logistics, hold a BS and an MBA, am available for consulting in various domains and can be reached at “lfurman97” at G Mail. My goal in these posts is to present and discuss a phenomena I find “interesting” in a scientific sense. Investments in equities of various companies are risky. I am NOT a licensed stock broker, investment adviser or financial adviser and this should n0t be considered “Financial Advice” or “Investment Advice.”