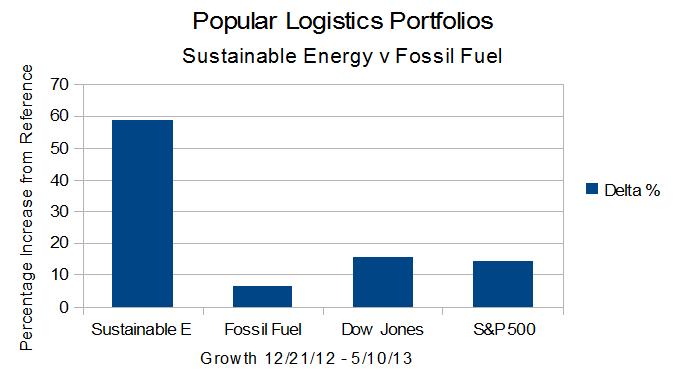
The trend is clear – if 4 1/2 months is enough to establish a trend – the Sustainable Energy portfolio is up 58.78% from 12/21/12 while the Fossil Fuel portfolio is only up 6.71%. The Dow is up 15.49% and the S&P 500 is up 14.24% in that same period.
Is it because Atmospheric Carbon Dioxide has reached 400 PPM? (NPR / NY Times) Is Wall Street reacting because Goldman Sachs and JP Morgan, and other investment banks and hedge funds are hiring analysts from Greenpeace or people like me with MBAs in Sustainability from Marlboro, the Presidio, and the Bainbridge Institute?
Table 1, below, shows the summary data from which the graph, above was constructed.
| Summary Data | ||||
| Portfolio | 12/21/12 | 05/10/13 | Delta | % |
| Sustainable Energy | 8,000,000 | 12,702,795 | 4,702,795 | 58.78% |
| Fossil Fuel | 8,000,000 | 8,537,134 | 537,134 | 6.71% |
| DJI | 13,091 | 15,118 | 2,027 | 15.49% |
| S&P 500 | 1,430 | 1,634 | 204 | 14.24% |
| Table 1 | ||||
Table 2, below, shows the stock price data for the Sustainable Energy portfolio.
| Sustainable Energy Portfolio – Stock Prices | ||||||
| Item | Company | Symbol | 12/21/12 | 05/10/13 | Delta | Delta % |
| 1 | Cree | CREE | 34.0 | 61.6 | 27.62 | 81.24% |
| 2 | First Solar | FSLR | 31.0 | 49.3 | 18.34 | 59.16% |
| 3 | GT Adv. Tech. | GTAT | 3.0 | 3.9 | 0.87 | 29.00% |
| 4 | Lighting Science | LSCG | 0.8 | 0.5 | -0.25 | -33.33% |
| 5 | Next Era Energy | NEE | 70.0 | 80.0 | 10.00 | 14.29% |
| 6 | Sun Power | SPWR | 5.4 | 18.0 | 12.57 | 231.49% |
| 7 | Solazyme | SZYM | 8.3 | 10.3 | 1.97 | 23.62% |
| 8 | Vestas | VWS | 6.3 | 10.4 | 4.09 | 64.82% |
| Table 2 | ||||||
Table 3, below, shows the stock price data for the Fossil Fuel portfolio.
| Fossil Fuel Portfolio – Stock Prices | ||||||
| Item | Company | Symbol | 12/21/12 | 05/10/13 | Delta | Delta % |
| 1 | BP | BP | 42.1 | 43.2 | 1.06 | 2.52% |
| 2 | Chevron Texaco | CVX | 109.7 | 123.2 | 13.52 | 12.32% |
| 3 | Conoco Philips | COP | 58.6 | 62.2 | 3.63 | 6.19% |
| 4 | Exxon Mobil | XOM | 87.2 | 90.1 | 2.91 | 3.34% |
| 5 | Royal Dutch Shell | RDS.A | 69.3 | 69.1 | -0.23 | -0.33% |
| 6 | Haliburton | HAL | 34.7 | 43.4 | 8.68 | 25.01% |
| 7 | Transocean | RIG | 45.6 | 54.6 | 9.00 | 19.72% |
| 8 | Peabody Coal | BTU | 26.4 | 21.0 | -5.34 | -20.27% |
| Table 3 | ||||||
Table 4, below, shows the investments in the Sustainable Energy Portfolio.
| Sustainable Energy Portfolio – Values | |||||||
| Item | Company | Symbol | Shares | 12/21/12 | 05/10/13 | Delta | Delta % |
| 1 | Cree | CREE | 29,411.8 | 1,000,000 | 1,812,353 | 812,353 | 81.24% |
| 2 | First Solar | FSLR | 32,258.1 | 1,000,000 | 1,591,613 | 591,613 | 59.16% |
| 3 | GT Adv. Tech. | GTAT | 333,333.3 | 1,000,000 | 1,290,000 | 290,000 | 29.00% |
| 4 | Lighting Science | LSCG | 1,333,333.3 | 1,000,000 | 666,667 | -333,333 | -33.33% |
| 5 | Next Era Energy | NEE | 14,285.7 | 1,000,000 | 1,142,857 | 142,857 | 14.29% |
| 6 | Sun Power | SPWR | 184,162.1 | 1,000,000 | 3,314,917 | 2,314,917 | 231.49% |
| 7 | Solazyme | SZYM | 119,904.1 | 1,000,000 | 1,236,211 | 236,211 | 23.62% |
| 8 | Vestas | VWS | 158,478.6 | 1,000,000 | 1,648,177 | 648,177 | 64.82% |
| total | 8,000,000 | 12,702,795 | 4,702,795 | 58.78% | |||
| Table 4 | |||||||
Table 5, below, shows the investments in the Fossil Fuel Energy Portfolio.
| Fossil Fuel Portfolio – Values | |||||||
| Value | Delta | ||||||
| Item | Company | Symbol | Shares | 12/21/12 | 05/10/13 | Amount | Per Cent |
| 1 | BP | BP | 23,741.7 | 1,000,000 | 1,025,166 | 25,166 | 2.52% |
| 2 | Chevron Texaco | CVX | 9,114.9 | 1,000,000 | 1,123,234 | 123,234 | 12.32% |
| 3 | Conoco Philips | COP | 17,064.8 | 1,000,000 | 1,061,945 | 61,945 | 6.19% |
| 4 | Exxon Mobil | XOM | 11,463.9 | 1,000,000 | 1,033,360 | 33,360 | 3.34% |
| 5 | Royal Dutch Shell | RDS.A | 14,432.1 | 1,000,000 | 996,681 | -3,319 | -0.33% |
| 6 | Haliburton | HAL | 28,810.1 | 1,000,000 | 1,250,072 | 250,072 | 25.01% |
| 7 | Transocean | RIG | 21,910.6 | 1,000,000 | 1,197,195 | 197,195 | 19.72% |
| 8 | Peabody Coal | BTU | 38,461.5 | 1,000,000 | 808,076 | -191,924 | -19.19% |
| total | 8,000,000 | 8,495,730 | 495,730 | 6.20% | |||
| Table 5 | |||||||
Note that this was an experiment. I did not invest $16 million of real money in these 16 companies. As noted in a previous post in this series, I am not a fund manager or professional investment adviser, nor do I hold a Series 7 or other financial industry license. If I was investing real money, I would not be investing equal amounts in these companies. I am long on the various companies in the Sustainable Energy space, and would short the companies in the fossil fuel space, except for Haliburton. The reasons I would not short Haliburton are classified.
Atmospheric Carbon
- L. Furman, 5/13/13, Atmospheric CO2: 400 PPM on May 9, 2013
Posts in this series
- L. Furman, 12/21/12, Popular Logistics Sustainable Energy Portfolio,
- L. Furman, 2/8/13, Nega-Watts, Nega-Fuel-Watts, Mega-Bucks,
- L. Furman, 2/9/13, Gold Bricks and Sink-Holes – The Risk & Reward of Fossil Fuel, Solar & Wind,
- L. Furman, 3/2/13, Sustainable Energy Portfolio UP 16% & Fossil Fuel Portfolio Up 1.7% – Since Dec.21, 2012..
- L. Furman, 3/23/13, Portfolio Simulation At 3 Months: Sustainable Energy: Up 22%. Fossil Fuels: 3%.
- L. Furman, 4/26/13, Earth Day, 2013. Oil Spills, Explosions, Fracking Business As Usual & The Stock Market Response
- L. Furman, 5/13/13, Popular Logistics Energy Portfolios: The Trend Continues.
–
A candidate for General Assembly (Site / Join / Contribute) to represent NJ Legislative District 12, which stretches from Matawan to to New Hanover and includes Old Bridge, Manalapan, Englishtown, Roosevelt, Millstone, Jackson, and various other towns (click here), and an analyst with Popular Logistics, Lawrence J. Furman holds a Bachelor’s in Biology, and an MBA in “Managing for Sustainability” from Marlboro College, Vermont. He also has experience in information technology. He can be reached at ‘Larry” at Furman For New Jersey. com.
–
I, Larry Furman, an analyst with Popular Logistics, hold a BS and an MBA, am available for consulting in various domains and can be reached at “lfurman97” at G Mail. My goal in these posts is to present and discuss phenomena which I find interesting and which appear indicative of systemic shifts in the economy. Investments in equities of various companies are risky. I do NOT hold a “Series 6” or “Series 7” license from the SEC or any similar licensing body. I am NOT a licensed stock broker, investment adviser or financial adviser and this should n0t be considered “Financial Advice” or “Investment Advice.”