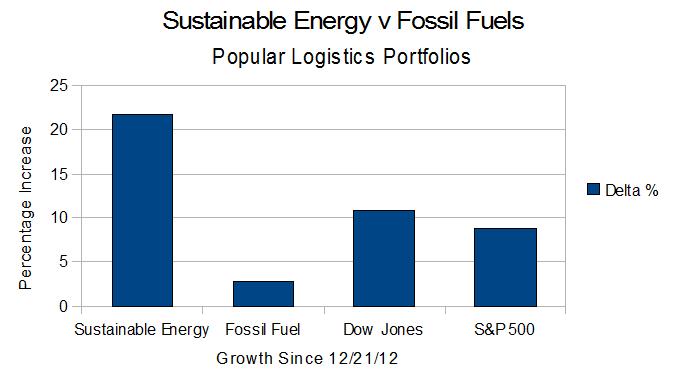
As of the close of trading on March 22, 2013, excluding the effects of dividends, the Sustainable Energy reference portfolio I created on 12/21/12 is up 21.67%, from $8.0 Million to $9.73 Million. Excluding the effects of dividends, the Fossil Fuel Reference Virtual Portfolio is up 2.7%, from $8.0 Million to $8.221 Million in the same time frame. The Dow Jones Industrial Average is up 10.85% and the S&P 500 is up 8.88%. Note that this is a simulation. Note also that this doesn’t take into account the effects of dividends.
These results are summarized in Table 1, below.
| Summary Data | |||||
| Value | |||||
| Portfolio | 12/21/12 | 03/22/13 | Delta | % | |
| Sustainable Energy | 8,000,000 | 9,733,284 | 1,733,284 | 21.67% | |
| Fossil Fuel | 8,000,000 | 8,221,212 | 221,212 | 2.77% | |
| Dow Jones | 13,091 | 14,512 | 1,421 | 10.85% | |
| S&P 500 | 1,430 | 1,557 | 127 | 8.88% | |
| Table 1 | |||||
Most of the increase in the Sustainable Energy stocks is in Sunpower, which has more than doubled and CREE, up 33.6%. Vestas is also up significantly. Solazyme is up but lags the indicies. First Solar and Lighting Sciences, and GT Advanced Tech. are down. This is detailed in Table 2. Most of the increase in the Fossil Fuel portfolio is in Haliburton and Transocean. Holding the portfolio down is Peabody Coal, down 22%, Table 3.
| Popular Logistics Sustainable Energy Portfolio | |||||
| Price | |||||
| Item | Company | 12/21/12 | 03/22/13 | Delta | Delta % |
| 1 | Cree | 34.00 | 45.42 | 11.42 | 33.59% |
| 2 | First Solar | 31.00 | 25.35 | -5.65 | -18.23% |
| 3 | GT Adv. Tech | 3.00 | 2.78 | -0.22 | -7.33% |
| 4 | Lighting Science | 0.75 | 0.63 | -0.12 | -16.00% |
| 5 | Next Era Energy | 70.00 | 72.36 | 2.36 | 3.37% |
| 6 | Sunpower | 5.43 | 11.84 | 6.41 | 118.05% |
| 7 | Solazyme | 8.34 | 8.74 | 0.4 | 4.80% |
| 8 | Vestas | 6.3 | 7.08 | 0.77 | 12.20% |
| Table 2 | |||||
| Popular Logistics Fossil Fuel Reference Portfolio | |||||
| Price | |||||
| Item | Company | 12/21/12 | 03/22/13 | Delta | Delta % |
| 1 | BP | 42.12 | 40.33 | -1.79 | -4.25% |
| 2 | Chevron Texaco | 109.71 | 116.9 | 7.19 | 6.55% |
| 3 | Conoco Philips | 58.6 | 58.28 | -0.32 | -0.55% |
| 4 | Exxon Mobil | 87.23 | 89.43 | 2.2 | 2.52% |
| 5 | Royal Dutch Shell | 69.29 | 65.78 | -3.51 | -5.07% |
| 6 | Haliburton | 34.71 | 40.63 | 5.92 | 17.06% |
| 7 | Transocean | 45.64 | 52.15 | 6.51 | 14.26% |
| 8 | Peabody Coal | 26.35 | 20.56 | -5.79 | -21.97% |
| Table 3 | |||||
As I have stated previously, I see this as a trend. The “Sustainable Energy” companies are growth stocks. The “Fossil Fuel” companies are, well, fossils. Stay tuned.
–
Posts in this series
- L. Furman, 12/21/12, Popular Logistics Sustainable Energy Portfolio,
- L. Furman, 2/8/13, Nega-Watts, Nega-Fuel-Watts, Mega-Bucks,
- L. Furman, 2/9/13, Gold Bricks and Sink-Holes – The Risk & Reward of Fossil Fuel, Solar & Wind,
- L. Furman, 3/2/13, Sustainable Energy Portfolio UP 16% & Fossil Fuel Portfolio Up 1.7% – Since Dec.21, 2012..
- L. Furman, 3/23/13, Portfolio Simulation At 3 Months: Sustainable Energy: Up 22%. Fossil Fuels: 3%.
–
–
I, Larry Furman, an analyst with Popular Logistics, hold a BS and an MBA, am available for consulting in various domains and can be reached at “lfurman97” at G Mail. My goal in these posts is to present and discuss phenomena which I find interesting and which appear indicative of systemic shifts in the economy. Investments in equities of various companies are risky. I do NOT hold a “Series 6” or “Series 7” license from the SEC or any similar licensing body. I am NOT a licensed stock broker, investment adviser or financial adviser and this should n0t be considered “Financial Advice” or “Investment Advice.”