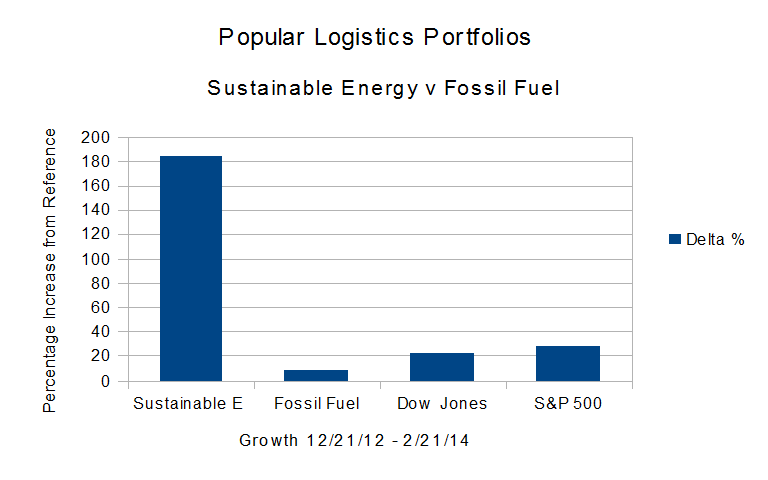
 The Dow Jones Industrial Average is up 23.01% from 12/21/12 to 2/21/14.
- The S&P 500 is up 28.39%.
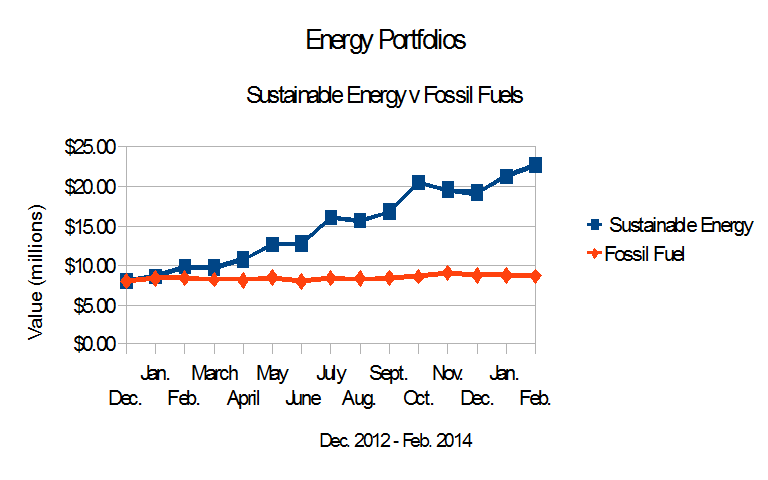
- The Fossil Fuel Portfolio continues to dramatically underperform the reference indices. It is up 8.7% from Dec. 21, 2012.
- The Sustainable Energy portfolio continues to dramatically outperform the averages, and is up 184.41% from Dec. 21, 2012.
Note that the Sustainable Energy portfolio does not include Solar City, SCTY, or Tesla Motors, TSLA. Solar City’s stock price is up 713.0%, from 10.73 on December 21, 2012 to 75.86 at the close of trading Feb. 21, 2014. Tesla is up 614.5% from 34 to 209.60.
 The data are summarized beginning in Table 1, below.
| Summary Data | ||||
| Portfolio | 12/21/12 | 02/21/14 | Delta | % |
| Sustainable Energy | 8,000,000 | 22,752,477 | 14,752,477 | 184.41% |
| Fossil Fuel | 8,000,000 | 8,696,336 | 696,336 | 8.70% |
| DJI | 13,091 | 16,103 | 3,012 | 23.01% |
| S&P 500 | 1,430 | 1,836 | 406 | 28.39% |
| Table 1 | ||||
The stock price data for the Sustainable Energy portfolio are in Table 2, below.
| Sustainable Energy Portfolio – Stock Prices | ||||||
| Item | Company | Symbol | 12/21/12 | 02/21/14 | Delta | Delta % |
| 1 | Cree | CREE | 34.0 | 60.3 | 26.28 | 77.29% |
| 2 | First Solar | FSLR | 31.0 | 55.9 | 24.93 | 80.42% |
| 3 | GT Adv. Tech. | GTAT | 3.0 | 12.1 | 9.11 | 303.67% |
| 4 | Lighting Science | LSCG | 0.8 | 0.4 | -0.36 | -48.00% |
| 5 | Next Era Energy | NEE | 70.0 | 92.6 | 22.56 | 32.23% |
| 6 | Sun Power | SPWR | 5.4 | 33.8 | 28.36 | 522.28% |
| 7 | Solazyme | SZYM | 8.3 | 11.2 | 2.90 | 34.77% |
| 8 | Vestas | VWS | 6.3 | 36.1 | 29.82 | 472.58% |
| Table 2 | ||||||
The stock price data for the Fossil Fuel Portfolio are in Table 3, below.
| Fossil Fuel Portfolio – Stock Prices | ||||||
| Item | Company | Symbol | 12/21/12 | 02/21/14 | Delta | Delta % |
| 1 | BP | BP | 42.1 | 49.8 | 7.69 | 18.26% |
| 2 | Chevron Texaco | CVX | 109.7 | 112.7 | 2.97 | 2.71% |
| 3 | Conoco Philips | COP | 58.6 | 64.7 | 6.08 | 10.38% |
| 4 | Exxon Mobil | XOM | 87.2 | 95.0 | 7.80 | 8.94% |
| 5 | Royal Dutch Shell | RDS.A | 69.3 | 73.5 | 4.18 | 6.03% |
| 6 | Haliburton | HAL | 34.7 | 55.3 | 20.59 | 59.32% |
| 7 | Transocean | RIG | 45.6 | 43.1 | -2.50 | -5.48% |
| 8 | Peabody Coal | BTU | 26.4 | 17.0 | -9.37 | -35.56% |
| Table 3 | ||||||
The valuation data for the Sustainable Energy Portfolio are in Table 4, below.
| Sustainable Energy Portfolio – Valuation | ||||||
| Value | Delta | |||||
| Item | Company | Symbol | 12/21/12 | 02/21/14 | Delta | Delta % |
| 1 | Cree | CREE | 1,000 | 1,773 | 773 | 77.29% |
| 2 | First Solar | FSLR | 1,000 | 1,804 | 804 | 80.42% |
| 3 | GT Adv. Tech. | GTAT | 1,000 | 4,037 | 3,037 | 303.67% |
| 4 | Lighting Science | LSCG | 1,000 | 520 | -480 | -48.00% |
| 5 | Next Era Energy | NEE | 1,000 | 1,322 | 322 | 32.23% |
| 6 | Sun Power | SPWR | 1,000 | 6,223 | 5,223 | 522.28% |
| 7 | Solazyme | SZYM | 1,000 | 1,348 | 348 | 34.77% |
| 8 | Vestas | VWS | 1,000 | 5,726 | 4,726 | 472.58% |
| total | 8,000 | 22,752 | 14,752 | 184.41% | ||
| Note that the values are in thousands. | ||||||
| Table 4 | ||||||
The valuation data for the Fossil Fuel Portfolio are in Table 5, below.
| Fossil Fuel Portfolio – Values | ||||||
| Value | Delta | |||||
| Item | Company | Symbol | 12/21/12 | 02/21/14 | Amount | Per Cent |
| 1 | BP | BP | 1,000 | 1,183 | 183 | 18.26% |
| 2 | Chevron Texaco | CVX | 1,000 | 1,027 | 27 | 2.71% |
| 3 | Conoco Philips | COP | 1,000 | 1,104 | 104 | 10.38% |
| 4 | Exxon Mobil | XOM | 1,000 | 1,089 | 89 | 8.94% |
| 5 | Royal Dutch Shell | RDS.A | 1,000 | 1,060 | 60 | 6.03% |
| 6 | Haliburton | HAL | 1,000 | 1,593 | 593 | 59.32% |
| 7 | Transocean | RIG | 1,000 | 945 | -55 | -5.48% |
| 8 | Peabody Coal | BTU | 1,000 | 653 | -347 | -34.69% |
| total | 8,000 | 8,655 | 655 | 8.18% | ||
| Note that the values are in thousands. | ||||||
| Table 5 | ||||||
The market capitalization data for the Sustainable Energy Portfolio are in Table 6.
| Sustainable Energy Portfolio | ||
| Market Capitalization | ||
| Item | Company | Market Cap |
| 1 | Cree | 8.8 |
| 2 | First Solar | 5.2 |
| 3 | GT Adv. Tech. | 1.1 |
| 4 | Lighting Science | 0.1 |
| 5 | Next Era Energy | 35.6 |
| 6 | Sun Power | 3.1 |
| 7 | Solazyme | 0.7 |
| 8 | Vestas | 5.8 |
| total | 60.39 | |
| Table 6 | ||
The market capitalization data for the Fossil Fuel Portfolio are in Table 7.
| Fossil Fuel Portfolio | ||
| Market Capitalization | ||
| Item | Company | Market Cap |
| 1 | BP | 137.1 |
| 2 | Chevron Texaco | 231.5 |
| 3 | Conoco Philips | 89.3 |
| 4 | Exxon Mobil | 383.4 |
| 5 | Royal Dutch Shell | 211.8 |
| 6 | Haliburton | 50.7 |
| 7 | Transocean | 16.8 |
| 8 | Peabody Coal | 5.1 |
| total | 1125.7 | |
| Table 7 | ||
Posts in this series
- L. Furman, 12/21/12, Popular Logistics Sustainable Energy Portfolio,
- L. Furman, 2/8/13, Nega-Watts, Nega-Fuel-Watts, Mega-Bucks,
- L. Furman, 2/9/13, Gold Bricks and Sink-Holes – The Risk & Reward of Fossil Fuel, Solar & Wind,
- L. Furman, 3/2/13, Sustainable Energy Portfolio UP 16% & Fossil Fuel Portfolio Up 1.7% – Since Dec.21, 2012..
- L. Furman, 3/23/13, Portfolio Simulation At 3 Months: Sustainable Energy: Up 22%. Fossil Fuels: 3%.
- L. Furman, 4/26/13, Earth Day, 2013. Oil Spills, Explosions, Fracking Business As Usual & The Stock Market Response
- L. Furman, 5/13/13, Popular Logistics Energy Portfolios: The Trend Continues.
- L. Furman, 6/24/13, Popular Logistics Energy Portfolios: At 6 months
- L. Furman, 7/22/13, Popular Logistics Energy Portfolios: Sustainable Energy Doubles. Fossil Fuels increase 5.4%
- L. Furman, 8/22/13, Popular Logistics Energy Portfolios: An Exercise in Climate Capitalism
- L. Furman, 9/20/13, Energy Portfolios – Investing for the Future
- L. Furman, 10/21/13, Sustainable Investing – Green Energy, Green Economy
- L. Furman, 11/22/13, Energy Portfolios: Minor Corrections, Overall Results In Line With the Trend
- L. Furman, 12/23/13, Energy Portfolios at One Year Sustainable Energy up 140%. Fossil Fuels up 9.85%.
- L. Furman, 12/26/13, Energy Portfolios and Reference Indices, 2013 Summary.
- L. Furman, 1/22/14, Energy Portfolios: 13 Months, Sustainable Energy up 167.4%, Fossil Fuels up 9.44%.
- L. Furman, 2/24/14, Energy Portfolios: 14 Months: Sustainable Energy up 184.4%, Fossil Fuels up 8.7%
–
I, Larry Furman, an analyst with Popular Logistics, hold a BS and an MBA, am available for consulting in various domains and can be reached at “lfurman97” at G Mail. My goal in these posts is to present and discuss phenomena which I find interesting and which appear indicative of systemic shifts in the economy. Investments in equities of various companies are risky. I do NOT hold a “Series 6” or “Series 7” license from the SEC or any similar licensing body. I am NOT a licensed stock broker, investment adviser or financial adviser and this should n0t be considered “Financial Advice” or “Investment Advice.”