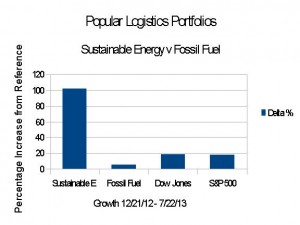
In December, 2012 I created two portfolios, a “Sustainable Energy” portfolio comprised of 8 stocks in the solar, LED lighting, wind and biofuel sectors, and a “Fossil Fuel” portfolio, comprised of 8 stocks in the coal, oil, and fracking sectors. The results, after seven months, as illustrated above:
The Sustainable Energy portfolio more than doubled: it is up 101.77%
The Reference Fossil Fuel portfolio is up 5.4%
The Dow Jones Industrial Average is up 18.75%
The S&P 500 is up 18.6%.
The Sustainable Energy portfolio has significantly outperformed the Dow Jones Industrials and the S&P 500 and the Fossil Fuel portfolio.
These data are summarized in table 1 and below.
| Summary Data | ||||
| Value | Value | |||
| Portfolio | 12/21/12 | 07/22/13 | Delta | % |
| Sustainable Energy | 8,000,000 | 16,141,443 | 8,141,443 | 101.77% |
| Fossil Fuel | 8,000,000 | 8,432,260 | 432,260 | 5.40% |
| DJI | 13,091 | 15,546 | 2,455 | 18.75% |
| S&P 500 | 1,430 | 1,696 | 266 | 18.60% |
| Table 1 | ||||
The portfolios are detailed in Tables 2 and 3.
Table 2 – Sustainable Energy Portfolio
| Sustainable Energy Portfolio – Stock Prices | ||||||
| Item | Company | Symbol | 12/21/12 | 07/22/13 | Delta | Delta % |
| 1 | Cree | CREE | 34.0 | 70.0 | 36.03 | 105.97% |
| 2 | First Solar | FSLR | 31.0 | 49.1 | 18.05 | 58.23% |
| 3 | GT Adv. Tech. | GTAT | 3.0 | 5.1 | 2.07 | 69.00% |
| 4 | Lighting Science | LSCG | 0.8 | 0.4 | -0.35 | -46.67% |
| 5 | Next Era Energy | NEE | 70.0 | 84.9 | 14.88 | 21.26% |
| 6 | Sun Power | SPWR | 5.4 | 26.2 | 20.80 | 383.06% |
| 7 | Solazyme | SZYM | 8.3 | 11.8 | 3.45 | 41.37% |
| 8 | Vestas | VWS | 6.3 | 17.8 | 11.48 | 181.93% |
| Table 2 | ||||||
Table 3 – Fossil Fuel Portfolio
| Fossil Fuel Portfolio – Stock Prices | ||||||
| Item | Company | Symbol | 12/21/12 | 07/22/13 | Delta | Delta % |
| 1 | BP | BP | 42.1 | 43.2 | 1.08 | 2.56% |
| 2 | Chevron Texaco | CVX | 109.7 | 127.0 | 17.32 | 15.79% |
| 3 | Conoco Philips | COP | 58.6 | 65.8 | 7.23 | 12.34% |
| 4 | Exxon Mobil | XOM | 87.2 | 94.8 | 7.60 | 8.71% |
| 5 | Royal Dutch Shell | RDS.A | 69.3 | 68.2 | -1.14 | -1.65% |
| 6 | Haliburton | HAL | 34.7 | 45.1 | 10.37 | 29.88% |
| 7 | Transocean | RIG | 45.6 | 49.6 | 3.96 | 8.68% |
| 8 | Peabody Coal | BTU | 26.4 | 16.3 | -10.03 | -38.06% |
| Table 3 | ||||||
Table 4 –
| Sustainable Energy Portfolio – Values | |||||||
| Item | Company | Symbol | Shares | 12/21/12 | 07/22/13 | Delta | Delta % |
| 1 | Cree | CREE | 29.41 | 1,000 | 2,060 | 1,060 | 105.97% |
| 2 | First Solar | FSLR | 32.26 | 1,000 | 1,582 | 582 | 58.23% |
| 3 | GT Adv. Tech. | GTAT | 333.33 | 1,000 | 1,690 | 690 | 69.00% |
| 4 | Lighting Science | LSCG | 1,333.33 | 1,000 | 533 | -467 | -46.67% |
| 5 | Next Era Energy | NEE | 14.29 | 1,000 | 1,213 | 213 | 21.26% |
| 6 | Sun Power | SPWR | 184.16 | 1,000 | 4,831 | 3,831 | 383.06% |
| 7 | Solazyme | SZYM | 119.90 | 1,000 | 1,414 | 414 | 41.37% |
| 8 | Vestas | VWS | 158.48 | 1,000 | 2,819 | 1,819 | 181.93% |
| total | 8,000 | 16,141 | 8,141 | 101.77% | |||
| Note that the number of shares and portfolio values are in thousands. | |||||||
| Table 4 | |||||||
Table 5 –
| Fossil Fuel Portfolio – Values | |||||||
| Value | Delta | ||||||
| Item | Company | Symbol | Shares | 12/21/12 | 07/22/13 | Amount | Per Cent |
| 1 | BP | BP | 23.74 | 1,000 | 1,026 | 26 | 2.56% |
| 2 | Chevron Texaco | CVX | 9.11 | 1,000 | 1,158 | 158 | 15.79% |
| 3 | Conoco Philips | COP | 17.06 | 1,000 | 1,123 | 123 | 12.34% |
| 4 | Exxon Mobil | XOM | 11.46 | 1,000 | 1,087 | 87 | 8.71% |
| 5 | Royal Dutch Shell | RDS.A | 14.43 | 1,000 | 984 | -16 | -1.65% |
| 6 | Haliburton | HAL | 28.81 | 1,000 | 1,299 | 299 | 29.88% |
| 7 | Transocean | RIG | 21.91 | 1,000 | 1,087 | 87 | 8.68% |
| 8 | Peabody Coal | BTU | 38.46 | 1,000 | 628 | -372 | -37.23% |
| total | 8,000 | 8,391 | 391 | 4.88% | |||
| Note that the number of shares and portfolio values are in thousands. | |||||||
| Table 5 | |||||||
Relevant posts: Atmospheric Carbon
- L. Furman, 5/13/13, Atmospheric CO2: 400 PPM on May 9, 2013
Posts in this series
- L. Furman, 12/21/12, Popular Logistics Sustainable Energy Portfolio,
- L. Furman, 2/8/13, Nega-Watts, Nega-Fuel-Watts, Mega-Bucks,
- L. Furman, 2/9/13, Gold Bricks and Sink-Holes – The Risk & Reward of Fossil Fuel, Solar & Wind,
- L. Furman, 3/2/13, Sustainable Energy Portfolio UP 16% & Fossil Fuel Portfolio Up 1.7% – Since Dec.21, 2012..
- L. Furman, 3/23/13, Portfolio Simulation At 3 Months: Sustainable Energy: Up 22%. Fossil Fuels: 3%.
- L. Furman, 4/26/13, Earth Day, 2013. Oil Spills, Explosions, Fracking Business As Usual & The Stock Market Response
- L. Furman, 5/13/13, Popular Logistics Energy Portfolios: The Trend Continues.
- L. Furman, 6/24/13, Popular Logistics Energy Portfolios: At 6 months
- L. Furman, 7/22/13, Popular Logistics Energy Portfolios: Sustainable Energy Doubles. Fossil Fuels increase 5.4%
–
A candidate for General Assembly (Site / Join / Contribute) to represent NJ Legislative District 12, which stretches from Matawan to to New Hanover and includes Old Bridge, Manalapan, Englishtown, Roosevelt, Millstone, Jackson, and various other towns (click here), and an analyst with Popular Logistics, Lawrence J. Furman holds a Bachelor’s in Biology, and an MBA in “Managing for Sustainability” from Marlboro College, Vermont.
As an analyst with Popular Logistics, hold a BS and an MBA, I am available for consulting in various domains and can be reached at “lfurman97” at G Mail. My goal in these posts is to present and discuss phenomena which I find interesting and which appear indicative of systemic shifts in the economy.
Investments in equities of various companies are risky. I do NOT hold a “Series 6” or “Series 7” license from the SEC or any similar licensing body. I am NOT a licensed stock broker, investment adviser or financial adviser and this should n0t be considered “Financial Advice” or “Investment Advice.”