On Dec. 21, 2011, reading that MidAmerican Energy was investing in utility scale solar energy generation, I looked at First Solar and Sunpower. Then I looked at six other companies in the sustainable energy world. I created a model portfolio. To make things interesting, I looked at eight companies in the fossil fuel industy and invested $16 Imaginary Million in these 16 companies, $1.0 Imaginary Million in each. As of the close of trading one year later, Friday, Dec. 20, 2013,
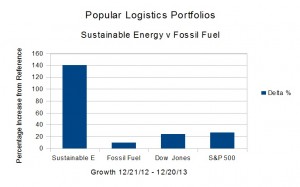
- The Dow Jones Industrial Average is up 23.91% from 12/21/12.
- The S&P 500 is up 27.13%.
- The Fossil Fuel Portfolio continues to dramatically underperform the reference indices. It is up 9.85% from Dec. 21, 2012.
- The Sustainable Energy portfolio continues to dramatically outperform the averages, and is up 140.31% from Dec. 21, 2012.
The data are summarized beginning in Table 1, below.
| Summary Data | ||||
| Portfolio | 12/21/12 | 12/20/13 | Delta | % |
| Sustainable Energy | 8,000,000 | 19,224,722 | 11,224,722 | 140.31% |
| Fossil Fuel | 8,000,000 | 8,787,818 | 787,818 | 9.85% |
| DJI | 13,091 | 16,221 | 3,130 | 23.91% |
| S&P 500 | 1,430 | 1,818 | 388 | 27.13% |
| Table 1 | ||||
The stock price data for the Sustainable Energy portfolio are in Table 2, below.
| Sustainable Energy Portfolio – Stock Prices | ||||||
| Item | Company | Symbol | 12/21/12 | 12/20/13 | Delta | Delta % |
| 1 | Cree | CREE | 34.0 | 59.7 | 25.65 | 75.44% |
| 2 | First Solar | FSLR | 31.0 | 55.9 | 24.87 | 80.23% |
| 3 | GT Adv. Tech. | GTAT | 3.0 | 8.4 | 5.37 | 179.00% |
| 4 | Lighting Science | LSCG | 0.8 | 0.4 | -0.35 | -46.67% |
| 5 | Next Era Energy | NEE | 70.0 | 84.8 | 14.82 | 21.17% |
| 6 | Sun Power | SPWR | 5.4 | 29.2 | 23.73 | 437.02% |
| 7 | Solazyme | SZYM | 8.3 | 10.0 | 1.67 | 20.02% |
| 8 | Vestas | VWS | 6.3 | 28.8 | 22.48 | 356.26% |
| Table 2 | ||||||
The stock price data for the Fossil Fuel Portfolio are in Table 3, below.
| Fossil Fuel Portfolio – Stock Prices | ||||||
| Item | Company | Symbol | 12/21/12 | 12/20/13 | Delta | Delta % |
| 1 | BP | BP | 42.1 | 46.9 | 4.74 | 11.25% |
| 2 | Chevron Texaco | CVX | 109.7 | 122.8 | 13.07 | 11.91% |
| 3 | Conoco Philips | COP | 58.6 | 69.9 | 11.28 | 19.25% |
| 4 | Exxon Mobil | XOM | 87.2 | 98.7 | 11.45 | 13.13% |
| 5 | Royal Dutch Shell | RDS.A | 69.3 | 69.6 | 0.26 | 0.38% |
| 6 | Haliburton | HAL | 34.7 | 50.5 | 15.83 | 45.61% |
| 7 | Transocean | RIG | 45.6 | 47.0 | 1.36 | 2.98% |
| 8 | Peabody Coal | BTU | 26.4 | 18.2 | -8.12 | -30.82% |
| Table 3 | ||||||
The valuation data for the Sustainable Energy Portfolio are in Table 4, below.
| Sustainable Energy Portfolio – Valuation | ||||||
| Value | Delta | |||||
| Item | Company | Symbol | 12/21/12 | 12/20/13 | Delta | Delta % |
| 1 | Cree | CREE | 1,000 | 59,650 | 58,650 | 5865.00% |
| 2 | First Solar | FSLR | 1,000 | 55,870 | 54,870 | 5487.00% |
| 3 | GT Adv. Tech. | GTAT | 1,000 | 8,370 | 7,370 | 737.00% |
| 4 | Lighting Science | LSCG | 1,000 | 400 | -600 | -60.00% |
| 5 | Next Era Energy | NEE | 1,000 | 84,820 | 83,820 | 8382.00% |
| 6 | Sun Power | SPWR | 1,000 | 29,160 | 28,160 | 2816.00% |
| 7 | Solazyme | SZYM | 1,000 | 10,010 | 9,010 | 901.00% |
| 8 | Vestas | VWS | 1,000 | 28,790 | 27,790 | 2779.00% |
| total | 8,000 | 277,070 | 269,070 | 3363.38% | ||
| Note that the values are in thousands. | ||||||
| Table 4 | ||||||
The valuation data for the Fossil Fuel Portfolio are in Table 5, below.
| Fossil Fuel Portfolio – Values | ||||||
| Value | Delta | |||||
| Item | Company | Symbol | 12/21/12 | 12/20/13 | Amount | Per Cent |
| 1 | BP | BP | 1,000 | 46,860 | 45,860 | 4586.00% |
| 2 | Chevron Texaco | CVX | 1,000 | 122,780 | 121,780 | 12178.00% |
| 3 | Conoco Philips | COP | 1,000 | 69,880 | 68,880 | 6888.00% |
| 4 | Exxon Mobil | XOM | 1,000 | 98,680 | 97,680 | 9768.00% |
| 5 | Royal Dutch Shell | RDS.A | 1,000 | 69,550 | 68,550 | 6855.00% |
| 6 | Haliburton | HAL | 1,000 | 50,540 | 49,540 | 4954.00% |
| 7 | Transocean | RIG | 1,000 | 47,000 | 46,000 | 4600.00% |
| 8 | Peabody Coal | BTU | 1,000 | 18,230 | 17,230 | 1723.00% |
| total | 8,000 | 523,520 | 515,520 | 6444.00% | ||
| Note that the values are in thousands. | ||||||
| Table 5 | ||||||
The market capitalization data for the Sustainable Energy Portfolio are in Table 6.
| Sustainable Energy Portfolio | ||
| Market Capitalization | ||
| Item | Company | Market Cap |
| 1 | Cree | 8.8 |
| 2 | First Solar | 5.2 |
| 3 | GT Adv. Tech. | 1.1 |
| 4 | Lighting Science | 0.1 |
| 5 | Next Era Energy | 35.6 |
| 6 | Sun Power | 3.1 |
| 7 | Solazyme | 0.7 |
| 8 | Vestas | 5.8 |
| total | 60.39 | |
| Table 6 | ||
The market capitalization data for the Fossil Fuel Portfolio are in Table 7.
| Fossil Fuel Portfolio | ||
| Market Capitalization | ||
| Item | Company | Market Cap |
| 1 | BP | 137.1 |
| 2 | Chevron Texaco | 231.5 |
| 3 | Conoco Philips | 89.3 |
| 4 | Exxon Mobil | 383.4 |
| 5 | Royal Dutch Shell | 211.8 |
| 6 | Haliburton | 50.7 |
| 7 | Transocean | 16.8 |
| 8 | Peabody Coal | 5.1 |
| total | 1125.7 | |
| Table 7 | ||
Posts in this series
- L. Furman, 12/21/12, Popular Logistics Sustainable Energy Portfolio,
- L. Furman, 2/8/13, Nega-Watts, Nega-Fuel-Watts, Mega-Bucks,
- L. Furman, 2/9/13, Gold Bricks and Sink-Holes – The Risk & Reward of Fossil Fuel, Solar & Wind,
- L. Furman, 3/2/13, Sustainable Energy Portfolio UP 16% & Fossil Fuel Portfolio Up 1.7% – Since Dec.21, 2012..
- L. Furman, 3/23/13, Portfolio Simulation At 3 Months: Sustainable Energy: Up 22%. Fossil Fuels: 3%.
- L. Furman, 4/26/13, Earth Day, 2013. Oil Spills, Explosions, Fracking Business As Usual & The Stock Market Response
- L. Furman, 5/13/13, Popular Logistics Energy Portfolios: The Trend Continues.
- L. Furman, 6/24/13, Popular Logistics Energy Portfolios: At 6 months
- L. Furman, 7/22/13, Popular Logistics Energy Portfolios: Sustainable Energy Doubles. Fossil Fuels increase 5.4%
- L. Furman, 8/22/13, Popular Logistics Energy Portfolios: An Exercise in Climate Capitalism
- L. Furman, 9/20/13, Energy Portfolios – Investing for the Future
- L. Furman, 10/21/13, Sustainable Investing – Green Energy, Green Economy
- L. Furman, 11/22/13, Energy Portfolios: Minor Corrections, Overall Results In Line With the Trend
- L. Furman, 12/23/13, Energy Portfolios at One Year Sustainable Energy up 140%. Fossil Fuels up 9.85%.
–
I, Larry Furman, an analyst with Popular Logistics, hold a BS and an MBA, am available for consulting in various domains and can be reached at “lfurman97” at G Mail. My goal in these posts is to present and discuss phenomena which I find interesting and which appear indicative of systemic shifts in the economy. Investments in equities of various companies are risky. I do NOT hold a “Series 6” or “Series 7” license from the SEC or any similar licensing body. I am NOT a licensed stock broker, investment adviser or financial adviser and this should n0t be considered “Financial Advice” or “Investment Advice.”