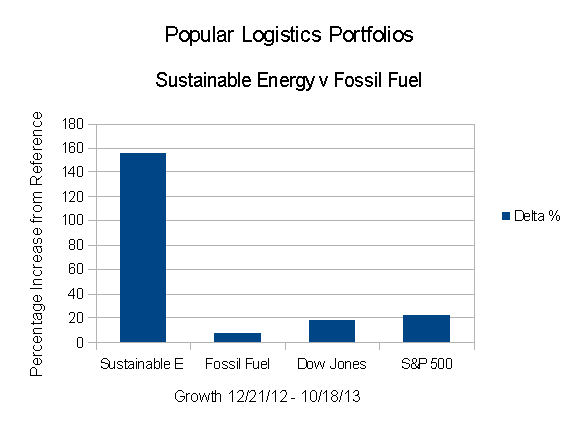
On Dec. 21, 2012, with $16 Imaginary Million, I created an investment simulation. I invested $1.0 Million in imaginary money in each of eight fossil fuel companies and eight sustainable energy companies. As of the close of trading 10 months later, Friday, Oct. 18, 2013, the trend, clearly evident after three months, in March of this year, continues.
- The Dow Jones Industrial Average is up 17.64% from 12/21/12.
- The S&P 500 is up 22.03%.
- The Fossil Fuel Portfolio, dramatically underperforming the reference indices, is up 7.47%.
- The Popular Logistics Sustainable Energy portfolio is up 156.14%.
As discussed last month, in “Investing for the Future,” the important question is: Is this a trend or a bubble? As I wrote, I think it’s a trend.
Jeremy Grantham, the “G” in GMO, invests with the expectation that all things being equal, a company’s valuation tends toward their arithmetic mean values. (Note that Mr. Grantham has not been contacted for this study.) But note that disruptive technologies are, by definition, game changers. Disruptive tech alters the landscape. If you looked at the airline, automobile and railroad industries over the 20th Century, automobiles and airlines waxed while railroads waned.
The future may be similar for Fossil Fuels and Sustainable Energy. The Market Capitalization of the Fossil Fuel portfolio is $1.13 Trillion. The Market Capitalization of the Sustainable Energy Portfolio is $0.06 Trillion ($60 Billion). The value of the companies of the Sustainable Energy portfolio is roughly 5.3% of the market capitalization of the companies of the Fossil Fuel portfolio. It can almost be described as a rounding error compared to the value of the Fossil Fuel portfolio. But if Mr. Grantham’s analysis is valid, and you aggregate the portfolios into one called “Energy” as opposed to a “Fossil Fuel” portfolio and a “Sustainable Energy” portfolio, then the shareholders of these various companies are in for an interesting few years.
The data are summarized beginning in Table 1, below.
| Summary Data | ||||
| Portfolio | 12/21/12 | 10/18/13 | Delta | % |
| Sustainable Energy | $8,000,000 | $20,490,963 | $12,490,963 | 156.14% |
| Fossil Fuel | $8,000,000 | $8,597,972 | $597,972 | 7.47% |
| DJI | 13,091 | 15,400 | 2,309 | 17.64% |
| S&P 500 | 1,430 | 1,745 | 315 | 22.03% |
| Table 1 | ||||
The stock price data for the Sustainable Energy portfolio are in Table 2, below.
| Sustainable Energy Portfolio – Stock Prices | ||||||
| Item | Company | Symbol | 12/21/12 | 10/18/13 | Delta | Delta % |
| 1 | Cree | CREE | 34.0 | 73.9 | 39.86 | 117.24% |
| 2 | First Solar | FSLR | 31.0 | 50.0 | 18.97 | 61.19% |
| 3 | GT Adv. Tech. | GTAT | 3.0 | 8.6 | 5.63 | 187.67% |
| 4 | Lighting Science | LSCG | 0.8 | 0.4 | -0.35 | -46.67% |
| 5 | Next Era Energy | NEE | 70.0 | 83.5 | 13.54 | 19.34% |
| 6 | Sun Power | SPWR | 5.4 | 33.6 | 28.14 | 518.23% |
| 7 | Solazyme | SZYM | 8.3 | 11.9 | 3.57 | 42.81% |
| 8 | Vestas | VWS | 6.3 | 28.4 | 22.04 | 349.29% |
| Table 2 | ||||||
The stock price data for the Fossil Fuel Portfolio are in Table 3, below.
| Fossil Fuel Portfolio – Stock Prices | ||||||
| Item | Company | Symbol | 12/21/12 | 10/18/13 | Delta | Delta % |
| 1 | BP | BP | 42.1 | 43.3 | 1.21 | 2.87% |
| 2 | Chevron Texaco | CVX | 109.7 | 119.7 | 9.94 | 9.06% |
| 3 | Conoco Philips | COP | 58.6 | 73.4 | 14.83 | 25.31% |
| 4 | Exxon Mobil | XOM | 87.2 | 87.6 | 0.32 | 0.37% |
| 5 | Royal Dutch Shell | RDS.A | 69.3 | 65.9 | -3.35 | -4.83% |
| 6 | Haliburton | HAL | 34.7 | 52.5 | 17.76 | 51.17% |
| 7 | Transocean | RIG | 45.6 | 45.9 | 0.25 | 0.55% |
| 8 | Peabody Coal | BTU | 26.4 | 18.5 | -7.85 | -29.79% |
| Table 3 | ||||||
The valuation data for the Sustainable Energy Portfolio are in Table 4, below.
| Sustainable Energy Portfolio – Valuation | |||||||
| Item | Company | Symbol | Shares | 12/21/12 | 10/18/13 | Delta | Delta % |
| 1 | Cree | CREE | 29.41 | 1,000 | 2,172 | 1,172 | 117.24% |
| 2 | First Solar | FSLR | 32.26 | 1,000 | 1,612 | 612 | 61.19% |
| 3 | GT Adv. Tech. | GTAT | 333.33 | 1,000 | 2,877 | 1,877 | 187.67% |
| 4 | Lighting Science | LSCG | 1,333.33 | 1,000 | 533 | -467 | -46.67% |
| 5 | Next Era Energy | NEE | 14.29 | 1,000 | 1,193 | 193 | 19.34% |
| 6 | Sun Power | SPWR | 184.16 | 1,000 | 6,182 | 5,182 | 518.23% |
| 7 | Solazyme | SZYM | 119.90 | 1,000 | 1,428 | 428 | 42.81% |
| 8 | Vestas | VWS | 158.48 | 1,000 | 4,493 | 3,493 | 349.29% |
| total | 8,000 | 20,491 | 12,491 | 156.14% | |||
| Note that the number of shares and portfolio values are in thousands. | |||||||
| Table 4 | |||||||
The valuation data for the Fossil Fuel Portfolio are in Table 5, below.
| Fossil Fuel Portfolio – Values | |||||||
| Value | Delta | ||||||
| Item | Company | Symbol | Shares | 12/21/12 | 10/18/13 | Amount | Per Cent |
| 1 | BP | BP | 23.74 | 1,000 | 1,029 | 29 | 2.87% |
| 2 | Chevron Texaco | CVX | 9.11 | 1,000 | 1,091 | 91 | 9.06% |
| 3 | Conoco Philips | COP | 17.06 | 1,000 | 1,253 | 253 | 25.31% |
| 4 | Exxon Mobil | XOM | 11.46 | 1,000 | 1,004 | 4 | 0.37% |
| 5 | Royal Dutch Shell | RDS.A | 14.43 | 1,000 | 952 | -48 | -4.83% |
| 6 | Haliburton | HAL | 28.81 | 1,000 | 1,512 | 512 | 51.17% |
| 7 | Transocean | RIG | 21.91 | 1,000 | 1,005 | 5 | 0.55% |
| 8 | Peabody Coal | BTU | 38.46 | 1,000 | 712 | -288 | -28.85% |
| total | 8,000 | 8,556 | 556 | 6.96% | |||
| Note that the number of shares and portfolio values are in thousands. | |||||||
| Table 5 | |||||||
The market capitalization data for the Sustainable Energy Portfolio are in Table 6.
| Sustainable Energy Portfolio | ||
| Market Capitalization | ||
| Item | Company | Market Cap (Billions) |
| 1 | Cree | $8.8 |
| 2 | First Solar | $5.2 |
| 3 | GT Adv. Tech. | $1.1 |
| 4 | Lighting Science | $0.1 |
| 5 | Next Era Energy | $35.6 |
| 6 | Sun Power | $3.1 |
| 7 | Solazyme | $0.7 |
| 8 | Vestas | $5.8 |
| total | $60.39 | |
| Table 6 | ||
The market capitalization data for the Fossil Fuel Portfolio are in Table 7.
| Fossil Fuel Portfolio | ||
| Market Capitalization | ||
| Item | Company | Market Cap (Billions) |
| 1 | BP | $137.1 |
| 2 | Chevron Texaco | $231.5 |
| 3 | Conoco Philips | $89.3 |
| 4 | Exxon Mobil | $383.4 |
| 5 | Royal Dutch Shell | $211.8 |
| 6 | Haliburton | $50.7 |
| 7 | Transocean | $16.8 |
| 8 | Peabody Coal | $5.1 |
| total | $1,125.7 | |
| Table 7 | ||
Stay tuned.
Posts in this series
- L. Furman, 12/21/12, Popular Logistics Sustainable Energy Portfolio,
- L. Furman, 2/8/13, Nega-Watts, Nega-Fuel-Watts, Mega-Bucks,
- L. Furman, 2/9/13, Gold Bricks and Sink-Holes – The Risk & Reward of Fossil Fuel, Solar & Wind,
- L. Furman, 3/2/13, Sustainable Energy Portfolio UP 16% & Fossil Fuel Portfolio Up 1.7% – Since Dec.21, 2012..
- L. Furman, 3/23/13, Portfolio Simulation At 3 Months: Sustainable Energy: Up 22%. Fossil Fuels: 3%.
- L. Furman, 4/26/13, Earth Day, 2013. Oil Spills, Explosions, Fracking Business As Usual & The Stock Market Response
- L. Furman, 5/13/13, Popular Logistics Energy Portfolios: The Trend Continues.
- L. Furman, 6/24/13, Popular Logistics Energy Portfolios: At 6 months
- L. Furman, 7/22/13, Popular Logistics Energy Portfolios: Sustainable Energy Doubles. Fossil Fuels increase 5.4%
- L. Furman, 8/22/13, Popular Logistics Energy Portfolios: An Exercise in Climate Capitalism
- L. Furman, 9/20/13, Energy Portfolios – Investing for the Future
- L. Furman, 10/21/13, Sustainable Investing – Green Energy, Green Economy
–
I, Larry Furman, an analyst with Popular Logistics, hold a BS and an MBA, am available for consulting in various domains and can be reached at “lfurman97” at G Mail. My goal in these posts is to present and discuss phenomena which I find interesting and which appear indicative of systemic shifts in the economy. Investments in equities of various companies are risky. I do NOT hold a “Series 6” or “Series 7” license from the SEC or any similar licensing body. I am NOT a licensed stock broker, investment adviser or financial adviser and this should n0t be considered “Financial Advice” or “Investment Advice.”