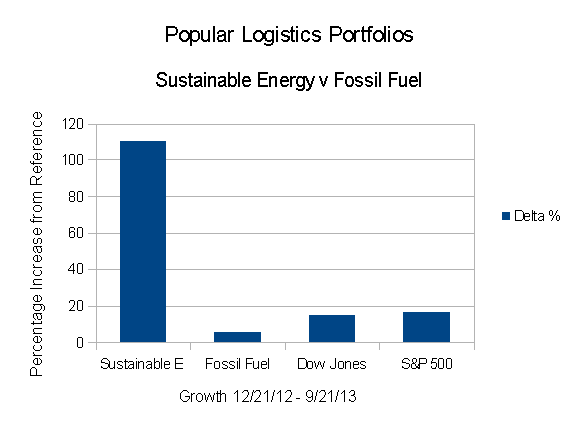
As of the close of trading Friday, Sept. 20, 2013, the trend, clearly evident by February 9, 2012 continues.
- The Dow Jones Industrial Average is up 14.66% from 12/21/12.
- The S&P 500 is up 16.36%.
- The Fossil Fuel Portfolio, significantly underperforming the reference indices, is up 5.95%.
- The Popular Logistics Sustainable Energy portfolio is up 110.10%.
 The important question is: Is this a trend or a bubble?
I think it’s a trend. While I want to think it’s a trend, utility scale solar is at or below $4.00 per watt and getting cheaper. Solar also scales from the 10 watts on a backpack to 10,000 watts or 10 KW on a rooftop to 500 million watts, 500 MW utilities are building. Wind is less expensive. Wind and solar are predictable.
For more details, consider the market capitalization of the companies in these portfolios, tables 6 and 7 . The fossil fuel industry is a “mature” industry, albeit one with problems. The eight companies in the portfolio are worth $1.1 Trillion. While Peabody Coal is worth $4.9 Billion, the other companies are big, and the barriers to entry are also tremendous. Exxon, which constitutes 35.45% of the portfolio, is worth $390 Billion. Conoco Philips, the smallest oil company is worth $86.8 Billion.
The sustainable energy companies, on the other hand, range from Lighting Sciences, worth $83.2 Million to Next Era Energy, worth $34.4 Billion. These companies, in total, are worth $55.7 Billion and more than half, 61.8% is in one company. The companies in the Sustainable Portfolio are worth 4.8% of the value of the companies in the Fossil Fuel Portfolio. They are a disruptive technology – or they are a rounding error.
The companies in the Sustainable Energy can fail – Lighting Sciences makes beautiful lamps – I have some – but it has dropped roughly 50% in the last 9 months. But they just as easily represent disruptive technology. An experiment like this could have been done comparing the value of transAtlantic ocean liners and airplanes 60 years ago.
The data are summarized beginning in Table 1, below.
| Summary Data | ||||
| Portfolio | 12/21/12 | 09/20/13 | Delta | % |
| Sustainable Energy | 8,000,000 | 16,807,890 | 8,807,890 | 110.10% |
| Fossil Fuel | 8,000,000 | 8,475,865 | 475,865 | 5.95% |
| DJI | 13,091 | 15,010 | 1,919 | 14.66% |
| S&P 500 | 1,430 | 1,664 | 234 | 16.36% |
| Table 1 | ||||
The stock price data for the Sustainable Energy portfolio are in Table 2, below.
| Sustainable Energy Portfolio – Stock Prices | ||||||
| Item | Company | Symbol | 12/21/12 | 09/20/13 | Delta | Delta % |
| 1 | Cree | CREE | 34.0 | 60.2 | 26.19 | 77.03% |
| 2 | First Solar | FSLR | 31.0 | 39.0 | 8.02 | 25.87% |
| 3 | GT Adv. Tech. | GTAT | 3.0 | 8.2 | 5.22 | 174.00% |
| 4 | Lighting Science | LSCG | 0.8 | 0.4 | -0.35 | -46.67% |
| 5 | Next Era Energy | NEE | 70.0 | 80.7 | 10.69 | 15.27% |
| 6 | Sun Power | SPWR | 5.4 | 24.2 | 18.72 | 344.75% |
| 7 | Solazyme | SZYM | 8.3 | 10.6 | 2.29 | 27.46% |
| 8 | Vestas | VWS | 6.3 | 22.9 | 16.60 | 263.07% |
| Table 2 | ||||||
The stock price data for the Fossil Fuel Portfolio are in Table 3, below.
| Fossil Fuel Portfolio – Stock Prices | ||||||
| Item | Company | Symbol | 12/21/12 | 09/20/13 | Delta | Delta % |
| 1 | BP | BP | 42.1 | 42.5 | 0.34 | 0.81% |
| 2 | Chevron Texaco | CVX | 109.7 | 124.9 | 15.21 | 13.86% |
| 3 | Conoco Philips | COP | 58.6 | 71.0 | 12.40 | 21.16% |
| 4 | Exxon Mobil | XOM | 87.2 | 88.7 | 1.43 | 1.64% |
| 5 | Royal Dutch Shell | RDS.A | 69.3 | 66.0 | -3.30 | -4.76% |
| 6 | Haliburton | HAL | 34.7 | 49.3 | 14.63 | 42.15% |
| 7 | Transocean | RIG | 45.6 | 45.1 | -0.58 | -1.27% |
| 8 | Peabody Coal | BTU | 26.4 | 18.2 | -8.19 | -31.08% |
| Table 3 | ||||||
The valuation data for the Sustainable Energy Portfolio are in Table 4, below.
| Sustainable Energy Portfolio – Valuation | |||||||
| Item | Company | Symbol | Shares | 12/21/12 | 09/20/13 | Delta | Delta % |
| 1 | Cree | CREE | 29.41 | 1,000 | 1,770 | 770 | 77.03% |
| 2 | First Solar | FSLR | 32.26 | 1,000 | 1,259 | 259 | 25.87% |
| 3 | GT Adv. Tech. | GTAT | 333.33 | 1,000 | 2,740 | 1,740 | 174.00% |
| 4 | Lighting Science | LSCG | 1,333.33 | 1,000 | 533 | -467 | -46.67% |
| 5 | Next Era Energy | NEE | 14.29 | 1,000 | 1,153 | 153 | 15.27% |
| 6 | Sun Power | SPWR | 184.16 | 1,000 | 4,448 | 3,448 | 344.75% |
| 7 | Solazyme | SZYM | 119.90 | 1,000 | 1,275 | 275 | 27.46% |
| 8 | Vestas | VWS | 158.48 | 1,000 | 3,631 | 2,631 | 263.07% |
| total | 8,000 | 16,808 | 8,808 | 110.10% | |||
| Note that the number of shares and portfolio values are in thousands. | |||||||
| Table 4 | |||||||
The valuation data for the Fossil Fuel Portfolio are in Table 5, below.
| Fossil Fuel Portfolio – Valuation | |||||||
| Value | Delta | ||||||
| Item | Company | Symbol | Shares | 12/21/12 | 09/20/13 | Amount | Per Cent |
| 1 | BP | BP | 23.74 | 1,000 | 1,008 | 8 | 0.81% |
| 2 | Chevron Texaco | CVX | 9.11 | 1,000 | 1,139 | 139 | 13.86% |
| 3 | Conoco Philips | COP | 17.06 | 1,000 | 1,212 | 212 | 21.16% |
| 4 | Exxon Mobil | XOM | 11.46 | 1,000 | 1,016 | 16 | 1.64% |
| 5 | Royal Dutch Shell | RDS.A | 14.43 | 1,000 | 952 | -48 | -4.76% |
| 6 | Haliburton | HAL | 28.81 | 1,000 | 1,421 | 421 | 42.15% |
| 7 | Transocean | RIG | 21.91 | 1,000 | 987 | -13 | -1.27% |
| 8 | Peabody Coal | BTU | 38.46 | 1,000 | 698 | -302 | -30.15% |
| total | 8,000 | 8,434 | 434 | 5.43% | |||
| Note that the number of shares and portfolio values are in thousands. | |||||||
| Table 5 | |||||||
The market capitalization data for the Sustainable Energy Portfolio are in Table 6.
| Sustainable Energy Portfolio | ||
| Market Capitalization | ||
| Item | Company | Market Cap |
| 1 | Cree | 7.2 |
| 2 | First Solar | 3.8 |
| 3 | GT Adv. Tech. | 1.0 |
| 4 | Lighting Science | 0.1 |
| 5 | Next Era Energy | 34.3 |
| 6 | Sun Power | 3.9 |
| 7 | Solazyme | 0.7 |
| 8 | Vestas | 4.7 |
| total | 55.68 | |
| Table 6 | ||
The market capitalization data for the Fossil Fuel Portfolio are in Table 7.
| Fossil Fuel Portfolio | ||
| Market Capitalization | ||
| Item | Company | Market Cap |
| 1 | BP | 133.8 |
| 2 | Chevron Texaco | 241.4 |
| 3 | Conoco Philips | 86.3 |
| 4 | Exxon Mobil | 390.3 |
| 5 | Royal Dutch Shell | 209.0 |
| 6 | Haliburton | 45.0 |
| 7 | Transocean | 16.2 |
| 8 | Peabody Coal | 4.9 |
| total | 1126.9 | |
| Table 7 | ||
Stay tuned.
Posts in this series
- L. Furman, 12/21/12, Popular Logistics Sustainable Energy Portfolio,
- L. Furman, 2/8/13, Nega-Watts, Nega-Fuel-Watts, Mega-Bucks,
- L. Furman, 2/9/13, Gold Bricks and Sink-Holes – The Risk & Reward of Fossil Fuel, Solar & Wind,
- L. Furman, 3/2/13, Sustainable Energy Portfolio UP 16% & Fossil Fuel Portfolio Up 1.7% – Since Dec.21, 2012..
- L. Furman, 3/23/13, Portfolio Simulation At 3 Months: Sustainable Energy: Up 22%. Fossil Fuels: 3%.
- L. Furman, 4/26/13, Earth Day, 2013. Oil Spills, Explosions, Fracking Business As Usual & The Stock Market Response
- L. Furman, 5/13/13, Popular Logistics Energy Portfolios: The Trend Continues.
- L. Furman, 6/24/13, Popular Logistics Energy Portfolios: At 6 months
- L. Furman, 7/22/13, Popular Logistics Energy Portfolios: Sustainable Energy Doubles. Fossil Fuels increase 5.4%
- L. Furman, 8/22/13, Popular Logistics Energy Portfolios: An Exercise in Climate Capitalism
- L. Furman, 9/20/13, Energy Portfolios – Investing for the Future
–
I, Larry Furman, an analyst with Popular Logistics, hold a BS and an MBA, am available for consulting in various domains and can be reached at “lfurman97” at G Mail. My goal in these posts is to present and discuss phenomena which I find interesting and which appear indicative of systemic shifts in the economy. Investments in equities of various companies are risky. I do NOT hold a “Series 6” or “Series 7” license from the SEC or any similar licensing body. I am NOT a licensed stock broker, investment adviser or financial adviser and this should n0t be considered “Financial Advice” or “Investment Advice.”