 On Dec. 21, 2011, with $16 Imaginary Million, I created an investment simulation. I invested $1.0 Million in imaginary money in each of eight fossil fuel companies and eight sustainable energy companies. As of the close of trading 11 months later, Friday, Nov. 22, 2013, the trend, clearly evident after three months, in March of this year, continues.
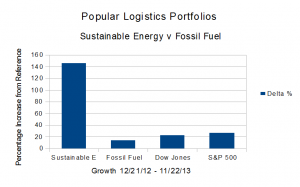
- The Dow Jones Industrial Average is up 22.72% from 12/21/12.
- The S&P 500 is up 26.22%.
- The Fossil Fuel Portfolio, dramatically underperforming the reference indices, is up 13.37% from Dec. 21, 2012.
- The Sustainable Energy portfolio is up 145.37% from Dec. 21, 2012.
- The Sustainable Energy Portfolio is also down 4.39% from October 18, 2013.
Note that this represents a retreat of 4.39% from the high of 156.14%, in October, 2013.
As discussed in September and October, last month, in Septermber, 2013, in “Investing for the Future,” and October, in “Sustainable Investing: Green Energy, Green Economy,” the important question is: Is this a trend or a bubble? As I wrote, I think it’s a trend.
The 2,000 pound question, after Typhoon Haiyon, Hurricanes Sandy, Irene and Katrina, after the fires of 2012 and 2013, the Missouri River Floods of 2011 – which knocked out the Fort Calhoun nuclear plant – the super-tornadoes of 2013 – one with a two mile wide contact point on land, which tore through Oklahoma (CNN / National Geographic / Zerohedge) is will we survive to make the transition to clean sustainable energy?
or rather:
- “How many of us survive to make this transition?”
- “What will be the carrying capacity of earth for humans?”
The data are summarized beginning in Table 1, below.
| Summary Data | ||||
| Portfolio | 12/21/12 | 11/22/13 | Delta | % |
| Sustainable Energy | 8,000,000 | 19,629,393 | 11,629,393 | 145.37% |
| Fossil Fuel | 8,000,000 | 9,069,551 | 1,069,551 | 13.37% |
| DJI | 13,091 | 16,065 | 2,974 | 22.72% |
| S&P 500 | 1,430 | 1,805 | 375 | 26.22% |
| Table 1 | ||||
The stock price data for the Sustainable Energy portfolio are in Table 2, below.
| Sustainable Energy Portfolio – Stock Prices | ||||||
| Item | Company | Symbol | 12/21/12 | 11/22/13 | Delta | Delta % |
| 1 | Cree | CREE | 34.0 | 55.6 | 21.63 | 63.62% |
| 2 | First Solar | FSLR | 31.0 | 60.4 | 29.35 | 94.68% |
| 3 | GT Adv. Tech. | GTAT | 3.0 | 9.8 | 6.82 | 227.33% |
| 4 | Lighting Science | LSCG | 0.8 | 0.4 | -0.38 | -50.67% |
| 5 | Next Era Energy | NEE | 70.0 | 86.6 | 16.59 | 23.70% |
| 6 | Sun Power | SPWR | 5.4 | 31.0 | 25.52 | 469.98% |
| 7 | Solazyme | SZYM | 8.3 | 8.2 | -0.14 | -1.68% |
| 8 | Vestas | VWS | 6.3 | 27.5 | 21.20 | 335.97% |
| Table 2 | ||||||
The stock price data for the Fossil Fuel Portfolio are in Table 3, below.
| Fossil Fuel Portfolio – Stock Prices | ||||||
| Item | Company | Symbol | 12/21/12 | 11/22/13 | Delta | Delta % |
| 1 | BP | BP | 42.1 | 48.0 | 5.91 | 14.03% |
| 2 | Chevron Texaco | CVX | 109.7 | 124.0 | 14.32 | 13.05% |
| 3 | Conoco Philips | COP | 58.6 | 74.0 | 15.42 | 26.31% |
| 4 | Exxon Mobil | XOM | 87.2 | 95.0 | 7.78 | 8.92% |
| 5 | Royal Dutch Shell | RDS.A | 69.3 | 68.2 | -1.13 | -1.63% |
| 6 | Haliburton | HAL | 34.7 | 54.5 | 19.79 | 57.02% |
| 7 | Transocean | RIG | 45.6 | 52.1 | 6.45 | 14.13% |
| 8 | Peabody Coal | BTU | 26.4 | 18.5 | -7.90 | -29.98% |
| Table 3 | ||||||
The valuation data for the Sustainable Energy Portfolio are in Table 4, below.
| Sustainable Energy Portfolio – Valuation | ||||||
| Value | Delta | |||||
| Item | Company | Symbol | 12/21/12 | 11/22/13 | Delta | Delta % |
| 1 | Cree | CREE | 1,000 | 55,630 | 54,630 | 5463.00% |
| 2 | First Solar | FSLR | 1,000 | 60,350 | 59,350 | 5935.00% |
| 3 | GT Adv. Tech. | GTAT | 1,000 | 9,820 | 8,820 | 882.00% |
| 4 | Lighting Science | LSCG | 1,000 | 370 | -630 | -63.00% |
| 5 | Next Era Energy | NEE | 1,000 | 86,590 | 85,590 | 8559.00% |
| 6 | Sun Power | SPWR | 1,000 | 30,950 | 29,950 | 2995.00% |
| 7 | Solazyme | SZYM | 1,000 | 8,200 | 7,200 | 720.00% |
| 8 | Vestas | VWS | 1,000 | 27,510 | 26,510 | 2651.00% |
| total | 8,000 | 279,420 | 271,420 | 3392.75% | ||
| Note that the values are in thousands. | ||||||
| Table 4 | ||||||
The valuation data for the Fossil Fuel Portfolio are in Table 5, below.
| Fossil Fuel Portfolio – Values | ||||||
| Value | Delta | |||||
| Item | Company | Symbol | 12/21/12 | 11/22/13 | Amount | Per Cent |
| 1 | BP | BP | 1,000 | 48,030 | 47,030 | 4703.00% |
| 2 | Chevron Texaco | CVX | 1,000 | 124,030 | 123,030 | 12303.00% |
| 3 | Conoco Philips | COP | 1,000 | 74,020 | 73,020 | 7302.00% |
| 4 | Exxon Mobil | XOM | 1,000 | 95,010 | 94,010 | 9401.00% |
| 5 | Royal Dutch Shell | RDS.A | 1,000 | 68,160 | 67,160 | 6716.00% |
| 6 | Haliburton | HAL | 1,000 | 54,500 | 53,500 | 5350.00% |
| 7 | Transocean | RIG | 1,000 | 52,090 | 51,090 | 5109.00% |
| 8 | Peabody Coal | BTU | 1,000 | 18,450 | 17,450 | 1745.00% |
| total | 8,000 | 534,290 | 526,290 | 6578.63% | ||
| Note that the values are in thousands. | ||||||
| Table 5 | ||||||
The market capitalization data for the Sustainable Energy Portfolio are in Table 6.
| Sustainable Energy Portfolio | ||
| Market Capitalization | ||
| Item | Company | Market Cap (Billions) |
| 1 | Cree | 8.8 |
| 2 | First Solar | 5.2 |
| 3 | GT Adv. Tech. | 1.1 |
| 4 | Lighting Science | 0.1 |
| 5 | Next Era Energy | 35.6 |
| 6 | Sun Power | 3.1 |
| 7 | Solazyme | 0.7 |
| 8 | Vestas | 5.8 |
| total | 60.39 | |
| Table 6 | ||
The market capitalization data for the Fossil Fuel Portfolio are in Table 7.
| Fossil Fuel Portfolio | ||
| Market Capitalization | ||
| Item | Company | Market Cap (Billions) |
| 1 | BP | 137.1 |
| 2 | Chevron Texaco | 231.5 |
| 3 | Conoco Philips | 89.3 |
| 4 | Exxon Mobil | 383.4 |
| 5 | Royal Dutch Shell | 211.8 |
| 6 | Haliburton | 50.7 |
| 7 | Transocean | 16.8 |
| 8 | Peabody Coal | 5.1 |
| total | 1125.7 | |
| Table 7 | ||
As noted above, stay tuned.
Posts in this series
- L. Furman, 12/21/12, Popular Logistics Sustainable Energy Portfolio,
- L. Furman, 2/8/13, Nega-Watts, Nega-Fuel-Watts, Mega-Bucks,
- L. Furman, 2/9/13, Gold Bricks and Sink-Holes – The Risk & Reward of Fossil Fuel, Solar & Wind,
- L. Furman, 3/2/13, Sustainable Energy Portfolio UP 16% & Fossil Fuel Portfolio Up 1.7% – Since Dec.21, 2012..
- L. Furman, 3/23/13, Portfolio Simulation At 3 Months: Sustainable Energy: Up 22%. Fossil Fuels: 3%.
- L. Furman, 4/26/13, Earth Day, 2013. Oil Spills, Explosions, Fracking Business As Usual & The Stock Market Response
- L. Furman, 5/13/13, Popular Logistics Energy Portfolios: The Trend Continues.
- L. Furman, 6/24/13, Popular Logistics Energy Portfolios: At 6 months
- L. Furman, 7/22/13, Popular Logistics Energy Portfolios: Sustainable Energy Doubles. Fossil Fuels increase 5.4%
- L. Furman, 8/22/13, Popular Logistics Energy Portfolios: An Exercise in Climate Capitalism
- L. Furman, 9/20/13, Energy Portfolios – Investing for the Future
- L. Furman, 10/21/13, Sustainable Investing – Green Energy, Green Economy
- L. Furman, 11/22/13, Energy Portfolios: Minor Corrections, Overall Results In Line With the Trend
–
I, Larry Furman, an analyst with Popular Logistics, hold a BS and an MBA, am available for consulting in various domains and can be reached at “lfurman97” at G Mail. My goal in these posts is to present and discuss phenomena which I find interesting and which appear indicative of systemic shifts in the economy. Investments in equities of various companies are risky. I do NOT hold a “Series 6” or “Series 7” license from the SEC or any similar licensing body. I am NOT a licensed stock broker, investment adviser or financial adviser and this should n0t be considered “Financial Advice” or “Investment Advice.”