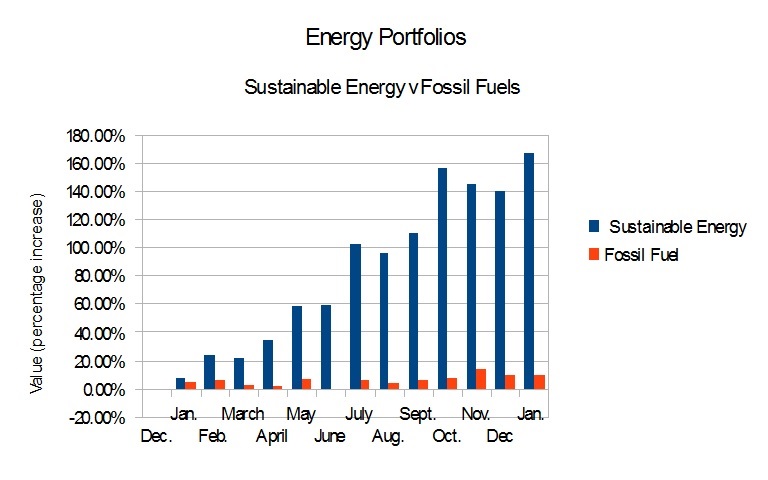
 Figure 1, above, shows the relative performance of my hypothetical investments in sustainable Energy and Fossil Fuels, since Dec. 21., 2012.
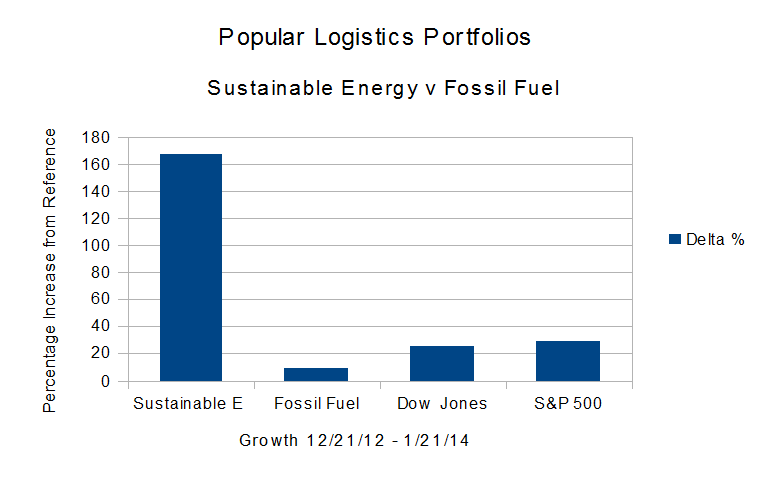
- The Dow Jones Industrial Average is up25.38% from 12/21/12.
- The S&P 500 is up28.95%.
- The Fossil Fuel Portfolio continues to dramatically underperform the reference indices. It is up 9.44% from Dec. 21, 2012, and down slightly from Dec. 20, 2013.
- The Sustainable Energy portfolio continues to dramatically outperform the fossil fuel portfolio and the averages, and is up 167.37% from Dec. 21, 2012.
As described in the earlier posts in this series, in Dec., 2012, I read that MidAmerican Energy was buying large scale solar electric generating stations being built by First Solar and Sunpower, and being financed by GE. This got me thinking …
- MidAmerican is owned by Berkshire Hathaway. I know Buffett and Munger like the great outdoors. They might be talking to Jeremy Grantham at GMO, but I don’t think they are asking the good people at 350.org, Greenpeace, or the Sierra Club for investment advice.
- What if I invested in First Solar and Sunpower?
- And what about GT Advanced Technology, Cree, Lighting Sciences, Next Era Energy, Solazyme and Vestas?
- And what about the fossil fuel industry?
- How would these compare to the Dow Jones Industrials and the S&P 500?
The companies in the Sustainable Energy industry are tiny compared to the companies in the Fossil Fuel industry. But they will grow. I know the sustainable energy industry will mature and level off. But I think that maturation is a long time in coming. And as the subsidies end for fossil fuel, as we run out of natural resources to exploit, as the “externalities” become harder to sweep under the rug – like a contaminated water supply for 300,000 people in West Virginia …
 The data are summarized beginning in Table 1, below.
| Summary Data | ||||
| Portfolio | 12/21/12 | 01/21/14 | Delta | % |
| Sustainable Energy | 8,000,000 | 21,389,459 | 13,389,459 | 167.37% |
| Fossil Fuel | 8,000,000 | 8,755,249 | 755,249 | 9.44% |
| DJI | 13,091 | 16,414 | 3,323 | 25.38% |
| S&P 500 | 1,430 | 1,844 | 414 | 28.95% |
| Table 1 | ||||
The stock price data for the Sustainable Energy portfolio are in Table 2, below.
| Sustainable Energy Portfolio – Stock Prices | ||||||
| Item | Company | Symbol | 12/21/12 | 01/21/14 | Delta | Delta % |
| 1 | Cree | CREE | 34.0 | 62.8 | 28.83 | 84.79% |
| 2 | First Solar | FSLR | 31.0 | 51.8 | 20.81 | 67.13% |
| 3 | GT Adv. Tech. | GTAT | 3.0 | 9.3 | 6.28 | 209.33% |
| 4 | Lighting Science | LSCG | 0.8 | 0.4 | -0.39 | -51.33% |
| 5 | Next Era Energy | NEE | 70.0 | 89.1 | 19.05 | 27.21% |
| 6 | Sun Power | SPWR | 5.4 | 34.0 | 28.54 | 525.60% |
| 7 | Solazyme | SZYM | 8.3 | 10.4 | 2.10 | 25.18% |
| 8 | Vestas | VWS | 6.3 | 34.8 | 28.46 | 451.03% |
| Table 2 | ||||||
The stock price data for the Fossil Fuel Portfolio are in Table 3, below.
| Fossil Fuel Portfolio – Stock Prices | ||||||
| Item | Company | Symbol | 12/21/12 | 01/21/14 | Delta | Delta % |
| 1 | BP | BP | 42.1 | 48.5 | 6.41 | 15.22% |
| 2 | Chevron Texaco | CVX | 109.7 | 120.4 | 10.65 | 9.71% |
| 3 | Conoco Philips | COP | 58.6 | 68.3 | 9.66 | 16.48% |
| 4 | Exxon Mobil | XOM | 87.2 | 98.5 | 11.27 | 12.92% |
| 5 | Royal Dutch Shell | RDS.A | 69.3 | 71.3 | 1.99 | 2.87% |
| 6 | Haliburton | HAL | 34.7 | 49.8 | 15.07 | 43.42% |
| 7 | Transocean | RIG | 45.6 | 46.8 | 1.11 | 2.43% |
| 8 | Peabody Coal | BTU | 26.4 | 17.8 | -8.59 | -32.60% |
| Table 3 | ||||||
The valuation data for the Sustainable Energy Portfolio are in Table 4, below.
| Sustainable Energy Portfolio – Valuation | ||||||
| Value | Delta | |||||
| Item | Company | Symbol | 12/21/12 | 01/21/14 | Delta | Delta % |
| 1 | Cree | CREE | 1,000 | 1,848 | 848 | 84.79% |
| 2 | First Solar | FSLR | 1,000 | 1,671 | 671 | 67.13% |
| 3 | GT Adv. Tech. | GTAT | 1,000 | 3,093 | 2,093 | 209.33% |
| 4 | Lighting Science | LSCG | 1,000 | 487 | -513 | -51.33% |
| 5 | Next Era Energy | NEE | 1,000 | 1,272 | 272 | 27.21% |
| 6 | Sun Power | SPWR | 1,000 | 6,256 | 5,256 | 525.60% |
| 7 | Solazyme | SZYM | 1,000 | 1,252 | 252 | 25.18% |
| 8 | Vestas | VWS | 1,000 | 5,510 | 4,510 | 451.03% |
| total | 8,000 | 21,389 | 13,389 | 167.37% | ||
| Note that the values are in thousands. | ||||||
The valuation data for the Fossil Fuel Portfolio are in Table 5, below.
| Fossil Fuel Portfolio – Values | ||||||
| Value | Delta | |||||
| Item | Company | Symbol | 12/21/12 | 01/21/14 | Amount | Per Cent |
| 1 | BP | BP | 1,000 | 1,152 | 152 | 15.22% |
| 2 | Chevron Texaco | CVX | 1,000 | 1,097 | 97 | 9.71% |
| 3 | Conoco Philips | COP | 1,000 | 1,165 | 165 | 16.48% |
| 4 | Exxon Mobil | XOM | 1,000 | 1,129 | 129 | 12.92% |
| 5 | Royal Dutch Shell | RDS.A | 1,000 | 1,029 | 29 | 2.87% |
| 6 | Haliburton | HAL | 1,000 | 1,434 | 434 | 43.42% |
| 7 | Transocean | RIG | 1,000 | 1,024 | 24 | 2.43% |
| 8 | Peabody Coal | BTU | 1,000 | 683 | -317 | -31.69% |
| total | 8,000 | 8,714 | 714 | 8.92% | ||
| Note that the values are in thousands. | ||||||
| Table 5 | ||||||
The market capitalization data for the Sustainable Energy Portfolio are in Table 6.
| Sustainable Energy Portfolio | ||
| Market Capitalization | ||
| Item | Company | Market Cap |
| 1 | Cree | 8.8 |
| 2 | First Solar | 5.2 |
| 3 | GT Adv. Tech. | 1.1 |
| 4 | Lighting Science | 0.1 |
| 5 | Next Era Energy | 35.6 |
| 6 | Sun Power | 3.1 |
| 7 | Solazyme | 0.7 |
| 8 | Vestas | 5.8 |
| total | 60.39 | |
| Table 6 | ||
The market capitalization data for the Fossil Fuel Portfolio are in Table 7.
| Fossil Fuel Portfolio | ||
| Market Capitalization | ||
| Item | Company | Market Cap |
| 1 | BP | 137.1 |
| 2 | Chevron Texaco | 231.5 |
| 3 | Conoco Philips | 89.3 |
| 4 | Exxon Mobil | 383.4 |
| 5 | Royal Dutch Shell | 211.8 |
| 6 | Haliburton | 50.7 |
| 7 | Transocean | 16.8 |
| 8 | Peabody Coal | 5.1 |
| total | 1125.7 | |
| Table 7 | ||
Posts in this series
- L. Furman, 12/21/12, Popular Logistics Sustainable Energy Portfolio,
- L. Furman, 2/8/13, Nega-Watts, Nega-Fuel-Watts, Mega-Bucks,
- L. Furman, 2/9/13, Gold Bricks and Sink-Holes – The Risk & Reward of Fossil Fuel, Solar & Wind,
- L. Furman, 3/2/13, Sustainable Energy Portfolio UP 16% & Fossil Fuel Portfolio Up 1.7% – Since Dec.21, 2012..
- L. Furman, 3/23/13, Portfolio Simulation At 3 Months: Sustainable Energy: Up 22%. Fossil Fuels: 3%.
- L. Furman, 4/26/13, Earth Day, 2013. Oil Spills, Explosions, Fracking Business As Usual & The Stock Market Response
- L. Furman, 5/13/13, Popular Logistics Energy Portfolios: The Trend Continues.
- L. Furman, 6/24/13, Popular Logistics Energy Portfolios: At 6 months
- L. Furman, 7/22/13, Popular Logistics Energy Portfolios: Sustainable Energy Doubles. Fossil Fuels increase 5.4%
- L. Furman, 8/22/13, Popular Logistics Energy Portfolios: An Exercise in Climate Capitalism
- L. Furman, 9/20/13, Energy Portfolios – Investing for the Future
- L. Furman, 10/21/13, Sustainable Investing – Green Energy, Green Economy
- L. Furman, 11/22/13, Energy Portfolios: Minor Corrections, Overall Results In Line With the Trend
- L. Furman, 12/23/13, Energy Portfolios at One Year Sustainable Energy up 140%. Fossil Fuels up 9.85%.
- L. Furman, 12/26/13, Energy Portfolios and Reference Indices, 2013 Summary.
- L. Furman, 1/22/14, Energy Portfolios: 13 Months, Sustainable Energy up 167.4%, Fossil Fuels up 9.44%.
–
I, Larry Furman, an analyst with Popular Logistics, hold a BS and an MBA, am available for consulting in various domains and can be reached at “lfurman97” at G Mail. My goal in these posts is to present and discuss phenomena which I find interesting and which appear indicative of systemic shifts in the economy. Investments in equities of various companies are risky. I do NOT hold a “Series 6” or “Series 7” license from the SEC or any similar licensing body. I am NOT a licensed stock broker, investment adviser or financial adviser and this should n0t be considered “Financial Advice” or “Investment Advice.”