“The child who receives a hammer for Christmas will discover that everything needs pounding.”
One of my friends asked about “Six Sigma,” famously used by General Electric and Motorola to enhance the quality on their production lines, and famously used by Home Depot and 3M for short term gain and long term failure, (see “Six Sigma, So Yesterday,” on Business Week OnLine, here).
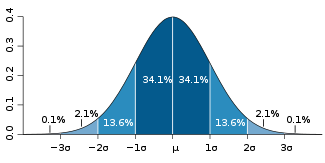
“I understand that Six Sigma means a very high quality system – with only 3.4 errors per million units,” my friend said. “What I don’t understand,” he added, “is the definition in terms of Standard Deviation and Normal Distribution. 99.99966% of the values will fall within 6 Standard Deviations of the Mean, compared to 99.73% of the values falling within 3 Standard Deviations of the Mean. What’s a standard deviation? And what’s a normal distribution?” Continue reading
