Category Archives: Connecting the Dots

The case of the Disappearing Bee

Now you see her; now you don't

Now you see her; now you don’t.

There aren’t enough bees to perform all of the pollination work in the United States. So, if you like to travel, make money doing it, and don’t mind a sting now and again, then professional beekeeping may just be for you.  And hey – it’s a seller’s market.

About 1.4 million hives get hauled to and around California every spring. They travel by plane, semi or pickup trucks. 60% of the American hives are engaged in commercial pollination. They pollinate almond trees, and other key crops:

  • Cranberries in Massachusetts and New Jersey.
  • Blueberries and peaches from Jersey to Georgia,
  • Pumpkins from Jersey to Illinois.
  • If it comes from a flowering plant, it’s pollinated by bees.

You can take your bees “On The Road” and make money without writing a word. And if you actually hate to travel, you can just send the bees.

Just make sure they all don’t all disappear.

Continue reading

Behind Oz’s Curtain

Bill Thompson

Bill Thompson

Behind Oz’s Curtain of ‘Law and Order’

By C.C. Reilly

Bill Thompson: Schools not Prisons

“The [$34 million] the city wants to spend on [the Brooklyn House of Detention design] contract would be better used as a means to reduce class sizes and build more schools.”
NYC Comptroller William C. Thompson, Jr.
November 19, 2009

Continue reading

Energy Portfolios: 19 Months: Sustainable up 222%, Fossil Fuel up 25%

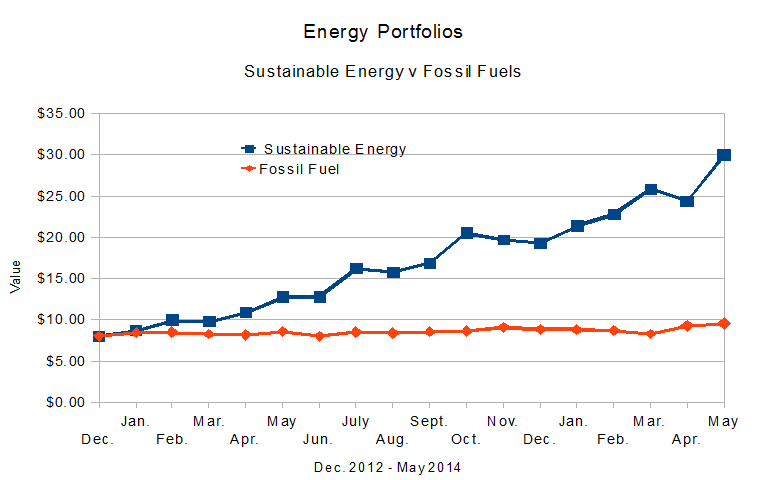
PLPortfolio.1407aOn Dec. 21, 2012, I put $16 Million imaginary dollars in equal imaginary investments in 16 real energy companies; Eight in the Sustainable Energy space and eight in the fossil fuel space. Here are the results since Dec. 21, 2012:

  • The Dow Jones Industrial Average is up 30.26%.
  • The S&P 500 is up 38.04%.
  • The Fossil Fuel Portfolio is continues to dramatically underperform the reference indices. It is up 25.08% from Dec. 21, 2012.
  • The Sustainable Energy portfolio is down 11% from last month, but is up 221.77% from Dec. 21, 2012.

The details are below.

Continue reading

Roller Coasters, Solar Power, Wind Power or Terrorist Tunnels

Qatari Emir w Ismail Haniya, Oct. 2012

Qatari Emir Hamad al-Thani with Ismail Haniya, Oct. 2012, Photo NY Times.

In October, 2012, Sheik Hamad bin Khalifa al-Thani, the Emir of Qatar, as reported in the NY Times, here, “pledged $400 million to build two housing complexes, rehabilitate three main roads and create a prosthetic center, among other projects” in Gaza.

The $400 Million could have built 133 MW of offshore wind or 100 MW of PV Solar electricity generation capacity.

Continue reading

Universal Databases, Marilyn Monroe & Scarlett Johansson

Marilyn Monroe

Marilyn Monroe

Scarlett Johansson

Scarlett Johansson

Relational Databases, RDBMSs, circa 1999, such as DB2, MS SQL Server, Oracle, Informix and Sybase, implementations of E. F. Codd‘s work at IBM and built according to Codd’s 12 Rules, are effective for solving OnLine Transaction Processing, or OLTP problems. These might be termed “Blue Quadrant” problems, if you consider Stonebraker’s Matrix, 1, below.

X-Ray of broken arm,  courtesy of C. Bethel, MD, and A. Dean, MD.

Broken arm, courtesy C. Bethel, MD, and A. Dean, MD.

They are billing systems, trading systems – accounting systems.  Relational databases are useful for tracking widgets and money, as long as those widgets can be described with words or numbers.  Processing simple data, even with a high volume of transactions.

Relational databases could also be used to store images, such as those of Scarlett Johansson or Marilyn Monroe, above, or X-Rays, left. However, these are stored in the database as Binary Large Objects, aka “BLOBs.” While RDBMSs could operate on large volumes of data in various ways, there are just two operations they could do on on BLOBs: store and retrieve.  They could not query on intrinsic properties of a BLOB. They could query on data that describe a BLOB, but not the BLOB itself. There is no other processing in a traditional RDBMS. And they could not search on images, only on text describing images.

Continue reading

Energy Portfolios, 18 Months, Analysis

EnergyPortfolios_Indices_2014_06 We are watching a paradigm shift.

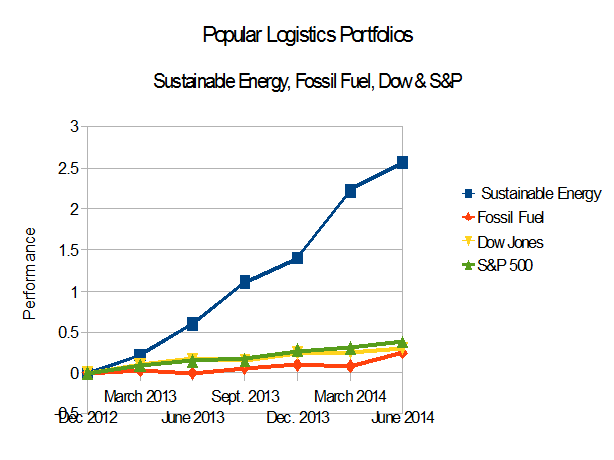
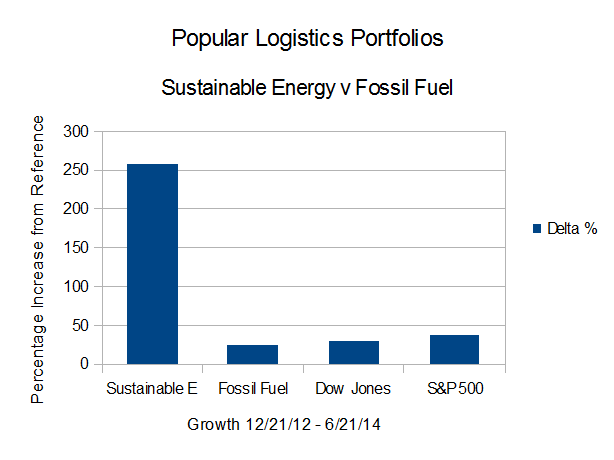
How else can we explain the dramatic rise of the Sustainable Energy portfolio, the equally dramatic underperformance of the Fossil Fuel portfolio, compared to the Dow Industrials and the S&P 500 since I started this experiment on Dec. 21, 2012? The data are in my post of June 24, 2014, Energy Portfolios, 18 Months: Sustainable up 257%, Fossil Fuels up 24.6%.

Consider these questions:

  1. Which companies are Disruptive or Subject to Disruption?
  2. Which companies are Evolving and which are doing what worked for the last 20/30/50/80 years?
  3. Can management execute?
  4. Is management asking for government subsidies?
  5. What about the long term side effects? What are the Economic Externalities?

Continue reading

Energy Portfolios: 18 Months: Sustainable up 257.06%: Fossil Fuel up 24.56%

PL_EnergyPort_14_06On Dec. 21, 2012, I put $16 Million imaginary dollars in equal imaginary investments in 16 real energy companies; Eight in the Sustainable Energy space and eight in the fossil fuel space. In the 18 months between the close of trading December 21, 2012 and the close of trading June 20, 2014,

  • The Dow Jones Industrial Average is up 29.46% from 12/21/12.
  • The S&P 500 is up 37.27%.
  • The Fossil Fuel Portfolio is up 24.56% from Dec. 21, 2012.
  • The Sustainable Energy portfolio is up 257.06% from Dec. 21, 2012.

In addition to the data summary, below, this post, the 21st in the series, will be followed with a summary analysis.

Continue reading

Energy Portfolios: 17 Months: Sustainable up 211.6%: Fossil Fuel up 18.52%

EnergyPortfolios_1405aThe Dow Jones Industrial Average is up 26.29% from 12/21/12.
The S&P 500 is up 32.03%.
The Fossil Fuel Portfolio is up 18.52% from Dec. 21, 2012.
The Sustainable Energy Portfolio is up 211.6% from Dec. 21, 2012. Continue reading

Energy Portfolios, 16 Months: Sustainable Energy up 204.25%, Fossil Fuel up 15.38%

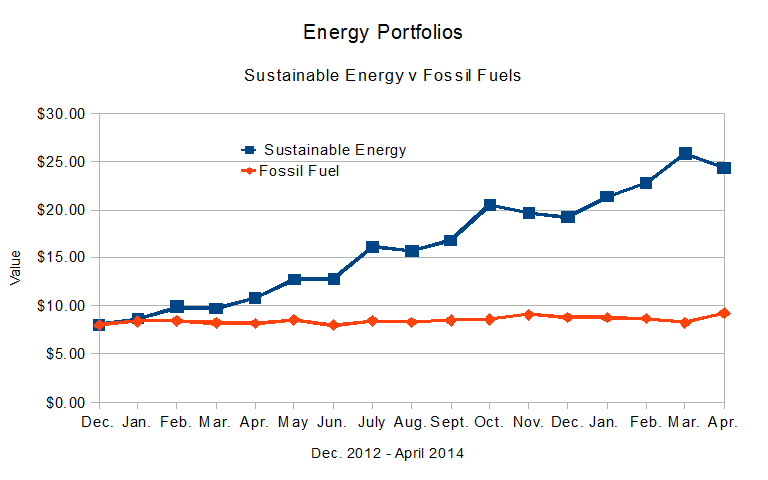
PL_Port.14.4aOn Dec. 21, 2012, I put $16 Million imaginary dollars in equal imaginary investments in 16 real energy companies; Eight in the Sustainable Energy space and eight in the fossil fuel space. The results:

  • The Dow Jones Industrial Average is up 24.54% from Dec. 21, 2012.
  • The S&P 500 is up 30.56% from Dec. 21, 2012.
  • The Fossil Fuel Portfolio had a great month, however, it continues to dramatically underperform the reference indices. It is up 15.38% from Dec. 21, 2012.
  • The Sustainable Energy portfolio had a bad month, however, it continues to dramatically outperform the averages, and is up 204.25% from Dec. 21, 2012


Continue reading

Energy Portfolios: 15 Months: Sustainable up 222.6%: Fossil Fuel up 7.3%

Line graph showing valuations of Sustainable and Fossil Fuel Energy Portfolios, not corrected for dividend distributions

On Dec. 21, 2012, I put $16 Million imaginary dollars in equal imaginary investments in 16 real energy companies; Eight in the Sustainable Energy space and eight in the fossil fuel space. The Sustainable Energy portfolio is composed of Cree and Lighting Sciences in the LED space, GTAT, which at the time made solar ovens for cooking PV wafers, and today is diversifying, First Solar and Sunpower in the solar space, Vestas, a wind company, Solazyme a biofuel company and Next Era, a utility. The fossil fuel companies are the oil companies BP, Chevron Texaco, Conoco Phillips, Exxon Mobil and RD Shell, the coal company Peabody Coal, and Haliburton and Transocean, companies in the offshore oil and oil and gas drilling service industries.

Continue reading

Energy Portfolios: 14 Months: Sustainable up 184.4%: Fossil Fuel up 8.7%

  • PL_Port.14.2bThe Dow Jones Industrial Average is up 23.01% from 12/21/12 to 2/21/14.
  • The S&P 500 is up 28.39%.
  • The Fossil Fuel Portfolio continues to dramatically underperform the reference indices. It is up 8.7% from Dec. 21, 2012.
  • The Sustainable Energy portfolio continues to dramatically outperform the averages, and is up 184.41% from Dec. 21, 2012.

Note that the Sustainable Energy portfolio does not include Solar City, SCTY, or Tesla Motors, TSLA. Solar City’s stock price is up 713.0%, from 10.73 on December 21, 2012 to 75.86 at the close of trading Feb. 21, 2014. Tesla is up 614.5% from 34 to 209.60.


Continue reading

Energy Portfolios: 13 Months: Sustainable up 167.4%: Fossil Fuel up 8.92%

PL_Portfolio_14_1Figure 1, above, shows the relative performance of my hypothetical investments in sustainable Energy and Fossil Fuels, since Dec. 21., 2012.

  • The Dow Jones Industrial Average is up25.38% from 12/21/12.
  • The S&P 500 is up28.95%.
  • The Fossil Fuel Portfolio continues to dramatically underperform the reference indices. It is up 9.44% from Dec. 21, 2012, and down slightly from Dec. 20, 2013.
  • The Sustainable Energy portfolio continues to dramatically outperform the fossil fuel portfolio and the averages, and is up 167.37% from Dec. 21, 2012.

As described in the earlier posts in this series, in Dec., 2012, I read that MidAmerican Energy was buying large scale solar electric generating stations being built by First Solar and Sunpower, and being financed by GE. This got me thinking … Continue reading

Virtualization: 20% Lower Cost to Build; 70% Lower Costs for Power, Cooling & Operations

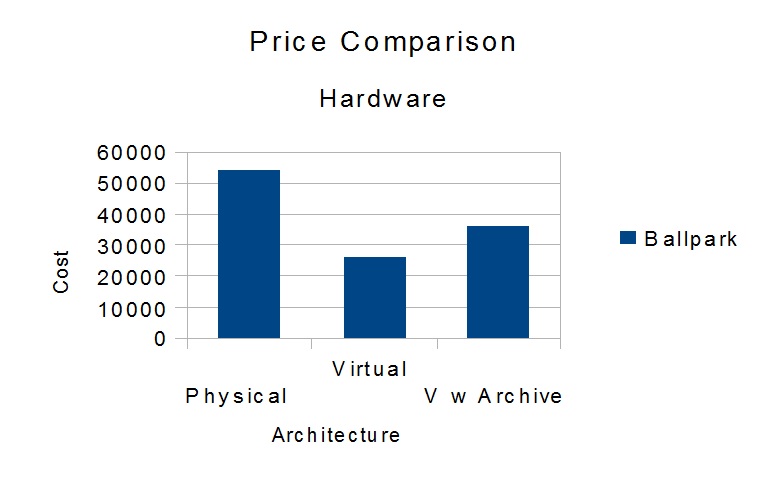
Virtualization, based on Table 0

Imagine an small to mid-sized enterprise which needs accounting, document management, e-mail,  a central file repository, centralized printer management, and a central anti-virus console. These services can be put on discrete servers, along with, using Microsoft’s authentication model, a redundant pair of machines described as “Domain Controllers.” Add an “Intranet” and a central backup system and you’re looking at 10 servers, at a cost, as shown in Table 1, below, in the neighborhood of $54,000.

The advantage of discrete servers for discrete functions is that maintenance on one system does not effect any others. By wrapping the logical functions – accounting, e-mail, etc – into “virtual machines” we get the same advantages – maintenance and upgrades to one system do not effect other systems – while reducing the total number of physical machines.

This can be “Virtualized” onto two or three servers at a cost, as shown in Table 2, below, in the neighborhood of $26,000 to $36,000. These are summarized in table 0, below.

Price Comparison
Item Ballpark
Physical $54,000.00
Virtual $26,000.00
V w Archive $36,000.00
Table 0

This savings also scales. Larger enterprises, which require more servers, may realize a 10 to 1 server consolidation.

Continue reading

Energy Portfolios & Reference Indices, 2013 Summary

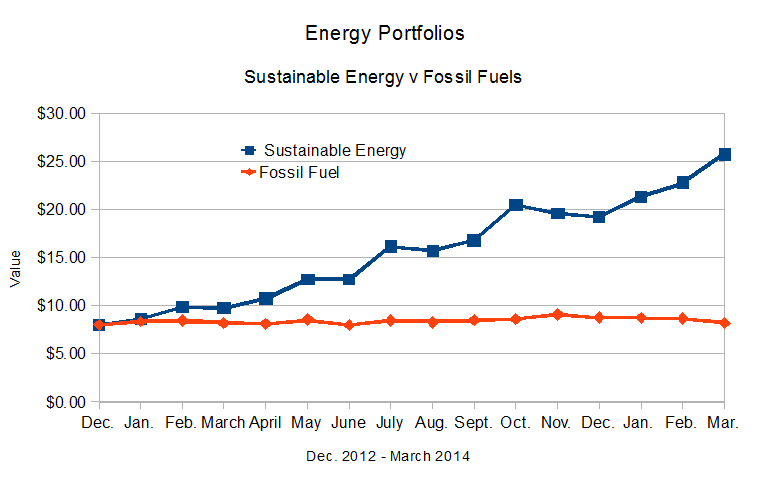
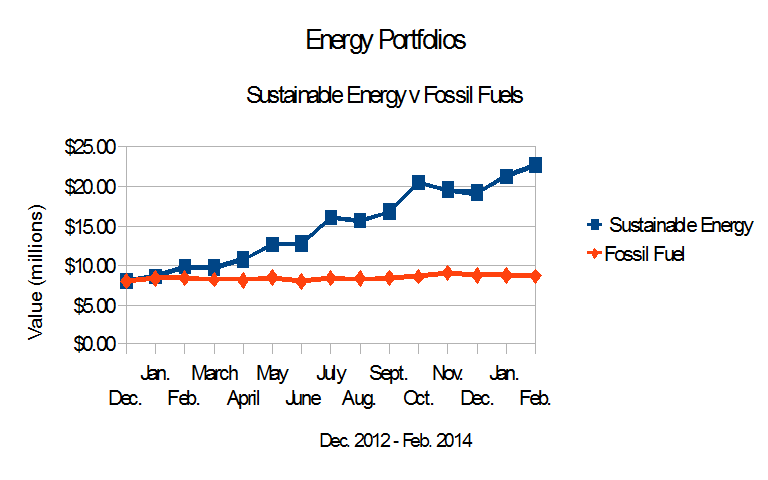
If a picture is worth a thousand words …

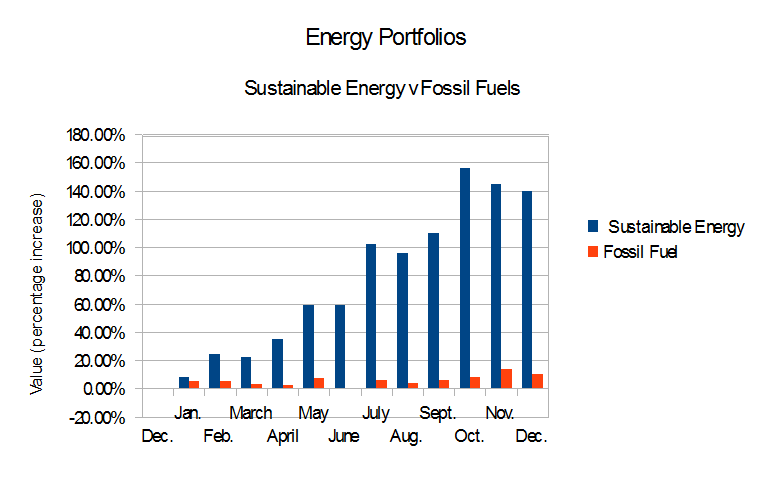
EnergyPortfolios_2013

here are two thousand words on Sustainable Investing in 2013.

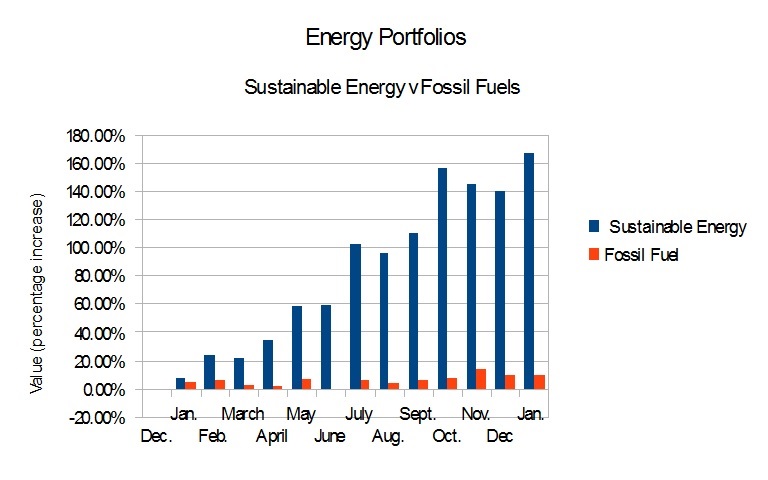
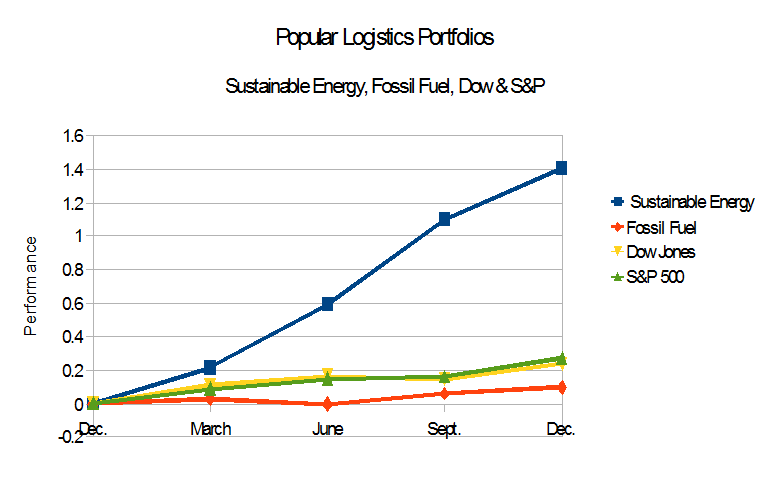
EnergyPortfolios_Indices

While the data may suggest that a “correction” may be in progress for the “Sustainable Energy” portfolio, and while the actions or inactions of various governments can dramatically effect performance of these portfolios, the Sustainable Energy Portfolio outperformed the Dow Jones Industrials and the S&P 500, both of which outperformed the Fossil Fuel Portfolio.

As the professional say, “Past performance is no guarantee of future performance.”

Continue reading

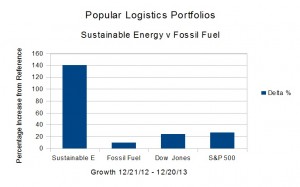
Energy Portfolios At One Year: Sustainable Energy up 140%, Fossil Fuel up 9.85%

PL_EnergyPort_13_12

On Dec. 21, 2011, reading that MidAmerican Energy was investing in utility scale solar energy generation, I looked at First Solar and Sunpower. Then I looked at six other companies in the sustainable energy world. I created a model portfolio. To make things interesting, I looked at eight companies in the fossil fuel industy and invested $16 Imaginary Million in these 16 companies, $1.0 Imaginary Million in each. As of the close of trading one year later, Friday, Dec. 20, 2013,

  • The Dow Jones Industrial Average is up 23.91% from 12/21/12.
  • The S&P 500 is up 27.13%.
  • The Fossil Fuel Portfolio continues to dramatically underperform the reference indices. It is up 9.85% from Dec. 21, 2012.
  • The Sustainable Energy portfolio continues to dramatically outperform the averages, and is up 140.31% from Dec. 21, 2012.

The data are summarized beginning in Table 1, below.

Continue reading