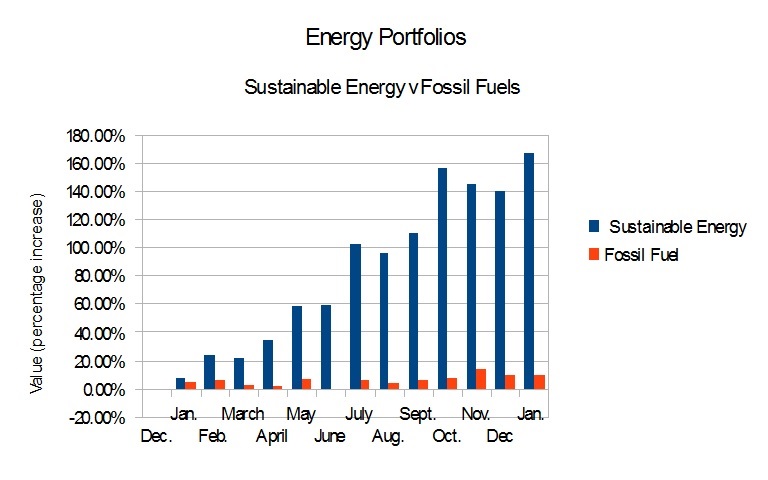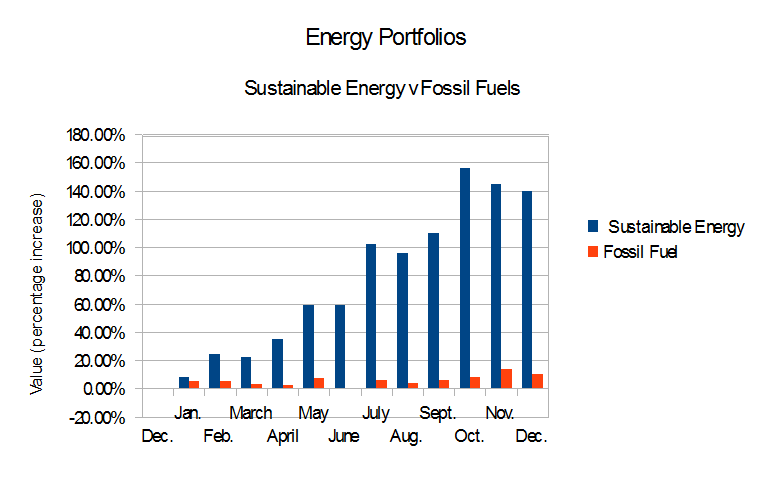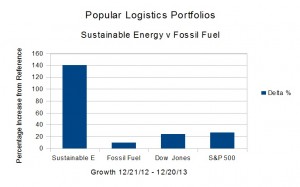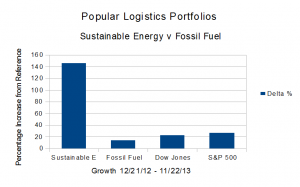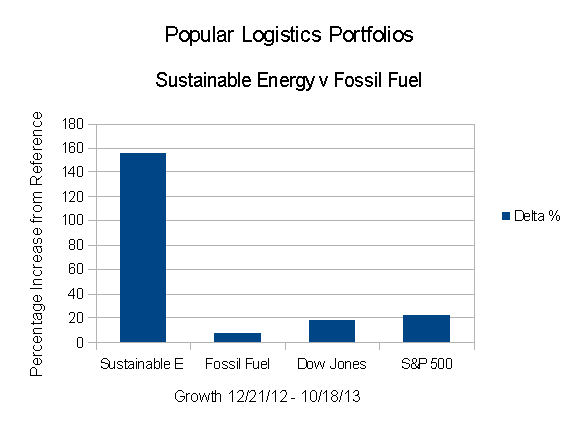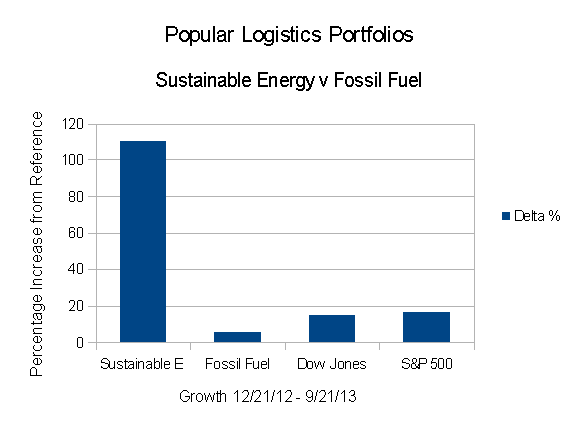
In December, 2012 I created two portfolios, a “Sustainable Energy” portfolio comprised of Cree, First Solar, GT Advanced Technology, Lighting Sciences, Next Era Energy, Sunpower Solar, Solazyme and Vestas, 8 stocks in the solar, LED lighting, wind and biofuel sectors, and a “Fossil Fuel” portfolio, comprised of BP, Chevron Texaco, Conoco Philips, Exxon Mobil, RD Shell, Haliburton, Transocean, and Peabody Coal, 8 stocks in the coal, oil, and fracking sectors. The results, after eight months, as illustrated above:
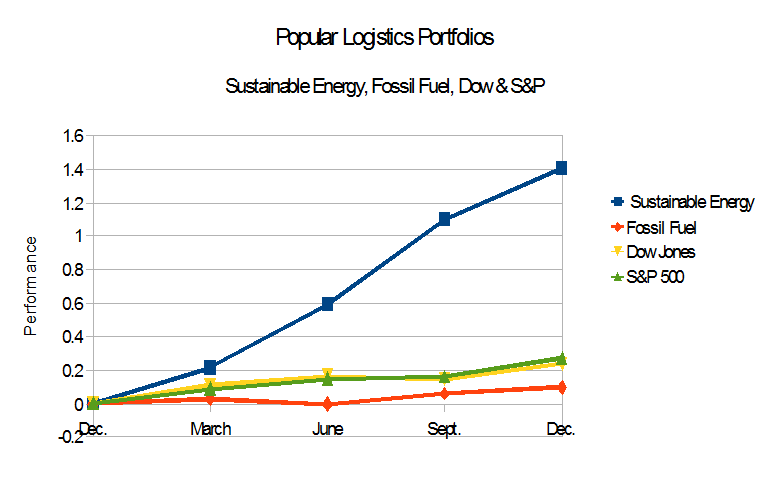
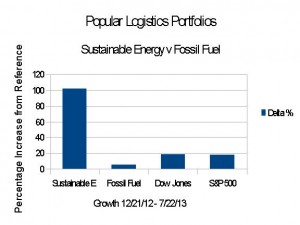
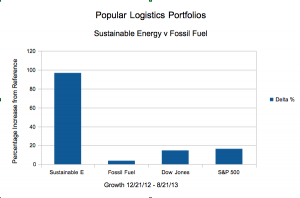
The Sustainable Energy portfolio, is now up 96.55%
The Reference Fossil Fuel portfolio is up 3.78%
The Dow Jones Industrial Average is up 14.66%
The S&P 500 is up 16.36%.
In a trend clearly evident in February, the Sustainable Energy portfolio has significantly outperformed the Dow Jones Industrials and the S&P 500, and the Fossil Fuel portfolio, which has significantly underperformed the indices.
These data are summarized in table 1 and below.
| Summary Data |
| Portfolio |
12/21/12 |
08/21/13 |
Delta |
% |
| Sustainable Energy |
$8,000,000 |
$15,724,266 |
$7,724,266 |
96.55% |
| Fossil Fuel |
$8,000,000 |
$8,302,069 |
$302,069 |
3.78% |
| DJI |
13,091 |
15,010 |
1,919 |
14.66% |
| S&P 500 |
1,430 |
1,664 |
234 |
16.36% |
| Table 1 |
The details are below the fold.
Continue reading →
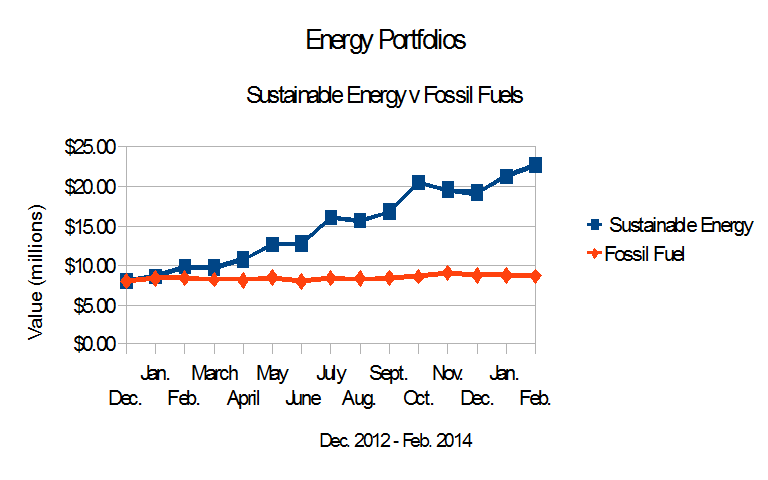 The Dow Jones Industrial Average is up 23.01% from 12/21/12 to 2/21/14.