Oil from the Deepwater Horizon
Fifth in a series I wish I didn’t have to write (0, 1, 2, 3, 4, 5)
After 42 days (six weeks) the Deepwater Horizon Well is still gushing an estimated 70,000 barrels per day. It has probably gushed around 2.94 Million barrels of crude oil into the Gulf of Mexico, about 123.5 Million gallons – 123,500,000 gallons.
2.94 Million Barrels. 123.5 Million Gallons. That’s a huge amount of oil in the Gulf of Mexico, but according to Nationmaster.com, the US consumed at a rate of 21 Million Barrels per Day in 2007. The U.S. Daily Burn is 7 Deepwater Horizon spills.

Arial view of the Kingston Spill Site, 4/19/10
It’s one tenth of the 1.2 billion gallons (1,200,000,000 gallons) of coal fly ash that on 12/22/08 flooded the Clinch and Emory Rivers and 3,000 acres near Kingston, Tennessee with arsenic, mercury, lead, and other toxic heavy metals. (Official EPA, NY Times, I Love Mountains)
That’s a fraction of the up to 6 million barrels per day of Kuwaiti oil Saddam burned after his rout in “Desert Storm” in 1991. And those fires burned for 6 Months (I Love Green).
And less than 0.667% of the 18 Billion Gallons of oil process waste Chevron Texaco allegedly dumped into the rain forests of Ecuador between 1964 and 1990. (click here and here).

Abandoned oil pool and production flare, Lago Agrio
It’s more than the consensus estimate of 250,000 barrels of oil spilled by the Exxon Valdez into the Prince William Sound, which after 21 years, remains degraded (click here and here).
So what’s different?
Let’s look at these again:
- Deepwater Horizon: 70,000 barrels a day, 40 days, 2.8 million barrels (and counting), Gulf of Mexico, 2010.
- TVA Kingston: 1.2 billion gallons, toxic sludge, upstream of Kingston, Tennessee, 12/22/08.
- Chevron Texaco: (alleged) 18 Billion Gallons (428.6 million barrles) of Oil Process Waste, Rainforests of Ecuador, 1964 to 1990.
- Oil Fires of Kuwait: 6 Million Barrels per Day, up to 6 Months, 1991.
- Exxon Valdez: 250,000 barrels, Prince William Sound, 1989.

Exxon Valdez in the Prince William Sound
So what’s different?
It’s not the Ecuadorian rainforest, the Kuwaiti desert, the backwoods of Tennessee (excuse me Bubba, but to the Yankees of Wall Street and the Brahmins of Boston, Kingston, Tennessee is backwoods) or a remote body of water off the coast of Alaska. It’s the Gulf of Mexico. That’s not our backyard; it’s our playground. The Gulf coast of Florida from Pensacola to Georgia is (soon will be was) known as the “Emerald Coast.” I was there. The beaches are (were) beautiful. In the morning, before the people came out to play you could see dolphins swimming in the waters. It’s our fishing hole: 25% of our seafood, 70% of our shrimp, came from the Gulf.
This isn’t the first fishing ground to die. We used to get Little Neck clams from the Long Island Sound, halibut and shad, even sturgeon, from the Hudson River, and Maryland crab from the Chesapeake. But this is the biggest, the most sudden and the most dramatic.
This is a singularity. The oil is on beaches, bays, bayous, and marshes of Louisiana, Mississippi, and Georgia. Some may be in the Gulf Stream, and if so will wrap around Florida and head up the Atlantic past the Outer Banks, the Chesapeake, the Jersey Shore, Fire Island, The Hamptons, Martha’s Vinyard, Cape Cod, and the rocky shores of Maine.
It’s not that BP wanted this to happen. They sell oil because we buy oil. The problem is that neither BP, nor the government, nor anyone, really knows how to stop it. The engineers are saying things like:
“This is interesting. I’ve never seen this before. What do you think we should do?”
“I don’t know, what do YOU think we should do?”
When engineers say things like that grab your hat and run like hell.
The Deepwater Horizen accident might do for oil what 3 Mile Island and Chernobyl did for nuclear power. (However, the biggest difference is that we are more dependent on fossil fuels than we were on nuclear power, and Chernobyl and 3 Mile Island made crystal clear to the people on Wall Street that their billion dollar investments could quickly turn into multi-billion liabilities.)
So along with your hat, coat, and camping gear, grab some solar modules.
I monitor an investment list-serve that is approaching this from a pure capitalist investor perspective, and they’re asking “Should you get out of oil?”
With oil still flooding into the Gulf and BP PLC’s failure to do anything about it, shivers are running down the spine of those who considered offshore oil a lucrative investment. Now with the planned ban on offshore drilling in the US, what will happen to the industry? What are the consequences for our economy as a whole? More importantly, what does it mean for YOUR portfolio?
When the investors, albeit the “contrarians,” are saying “Business as usual is bad for our wallets” it means the paradigm is shifting.
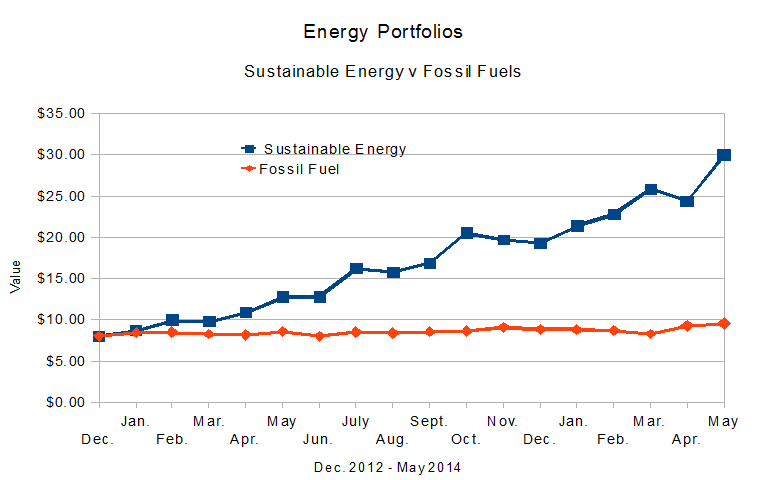
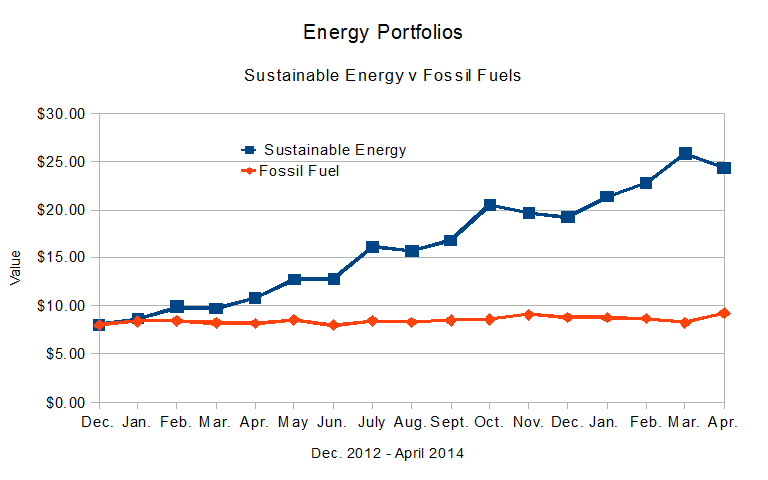
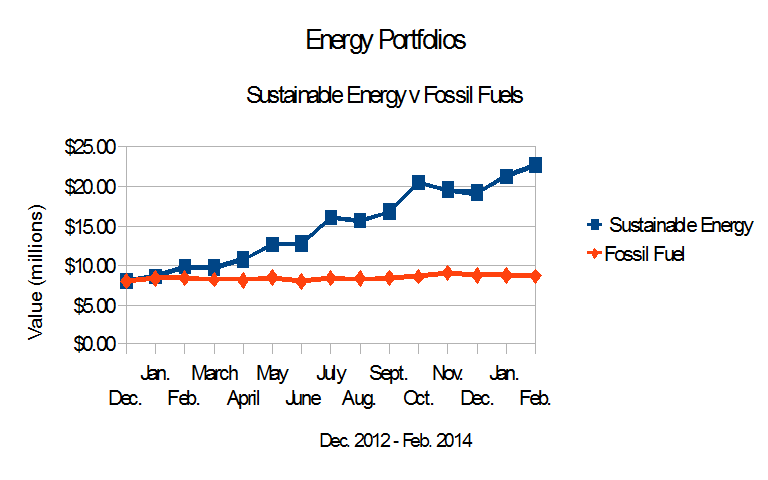
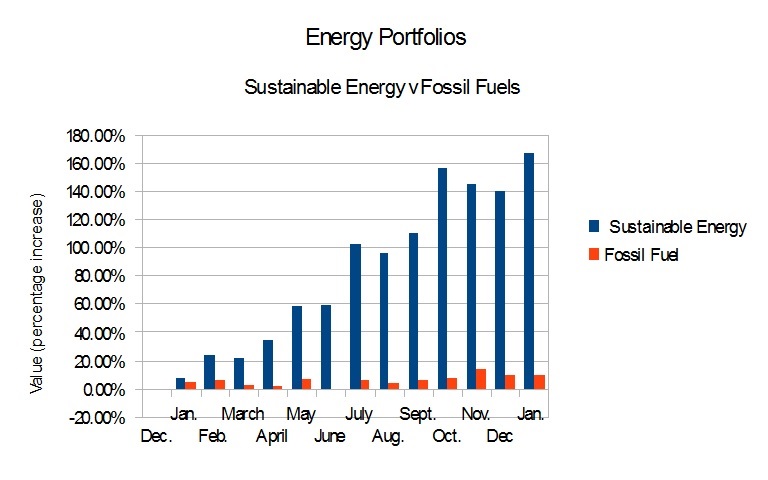
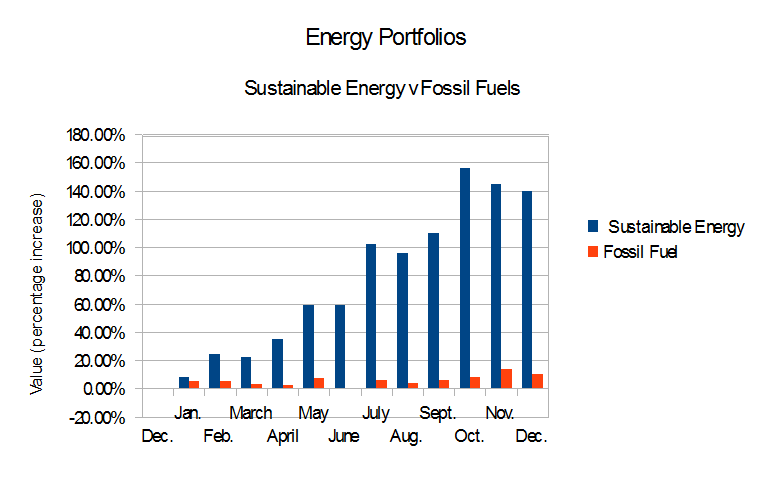
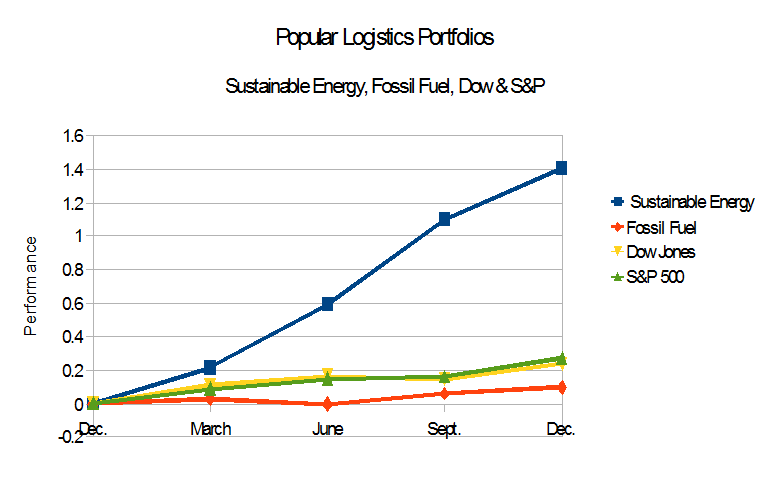
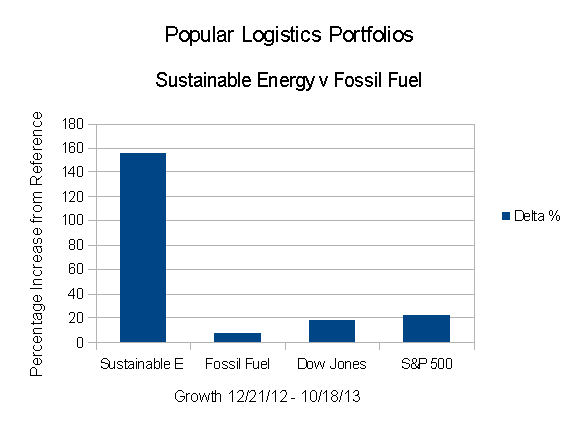
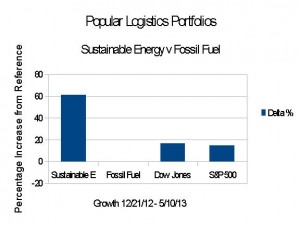
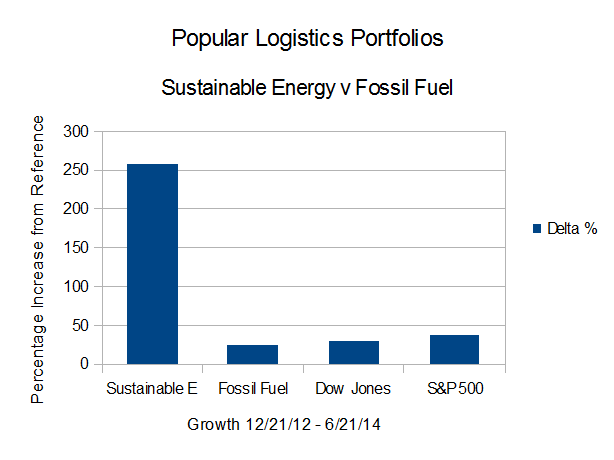 On Dec. 21, 2012, I put $16 Million imaginary dollars in equal imaginary investments in 16 real energy companies; Eight in the Sustainable Energy space and eight in the fossil fuel space. In the 18 months between the close of trading December 21, 2012 and the close of trading June 20, 2014,