Category Archives: Value Investing

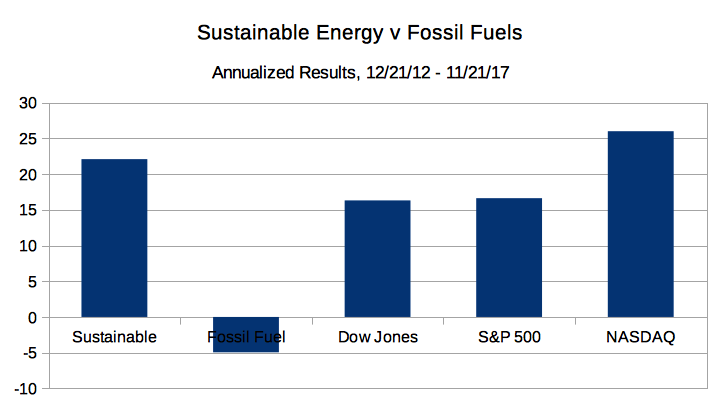
Energy Portfolios, 4 Years, 11 Months: Sustainable Energy Up 108.6%, Fossil Fuel DOWN 24.3%

On Dec. 21, 2012, I put $16 Million imaginary dollars into 16 real energy companies; $8.0 in the Sustainable Energy space and $8.0 in the fossil fuel space, $1.0 Million into each. Excluding the value of dividends and transaction costs, but including the bankruptcy or crash of three companies in the sustainable energy space,

In recent months the Sustainable Energy portfolio has dropped and the Fossil Fuel portfolio has increased. However, this may prove to be a short term correction that has more to do with macro-geopolitical events emanating from Washington, DC than global macroeconomic factors.    

As of the close of trading 59 months later,

  • The Market Capitalization of the sustainable energy companies is up 148.6%, from $39.58 Billion to $98.4 Billion. (See Table 6, below).
  • The Market Capitalization of the Fossil Fuel portfolio is DOWN 3.8%, from $1.09 Trillion to $1.05 Trillion. (See Table 7, below).
  • And the Market Capitalization of the Big Oil companies is DOWN 2.6%,from $1.03 Trillion on 9/21/17 to $1.007 Trillion on 10/20/17. (See Table 8, below)

In Addition

  • The Fossil Fuel portfolio went from $8.0 Million to $6.06 Million, down 24.3% overall, down 4.94% on an annualized basis.
  • The Sustainable Energy portfolio went from $8 Million to $16.7 Million, up 108.6%, overall and 22.1% on an annualized basis.
  • The Dow Jones Industrial Average is up 80.2% overall and 16.31% on an annualized basis; from 13,091 on 12/21/12 to 23,591 on 11/21/17.
  • The S&P 500 is up 81.8% overall and 16.63% on an annualized basis, from 1,430 on 12/21/12 to close at 2,599 on 11/21/17.

The details are below.
Continue reading

Energy Portfolios: Minor Corrections, Overall Results In Line with the Trend

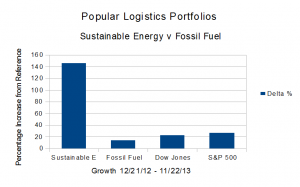
PlPort_2013_11On Dec. 21, 2011, with $16 Imaginary Million, I created an investment simulation. I invested $1.0 Million in imaginary money in each of eight fossil fuel companies and eight sustainable energy companies. As of the close of trading 11 months later, Friday, Nov. 22, 2013, the trend, clearly evident after three months, in March of this year, continues.

  • The Dow Jones Industrial Average is up 22.72% from 12/21/12.
  • The S&P 500 is up 26.22%.
  • The Fossil Fuel Portfolio, dramatically underperforming the reference indices, is up 13.37% from Dec. 21, 2012.
  • The Sustainable Energy portfolio is up 145.37% from Dec. 21, 2012.
  • The Sustainable Energy Portfolio is also down 4.39% from October 18, 2013.

Note  that this represents a retreat of 4.39% from the high of 156.14%, in October, 2013.

As discussed in September and October, last month, in Septermber, 2013, in “Investing for the Future,” and October, in “Sustainable Investing: Green Energy, Green Economy,” the important question is:  Is this a trend or a bubble?  As I wrote, I think it’s a trend.

The 2,000 pound question, after Typhoon Haiyon, Hurricanes Sandy,  Irene and Katrina, after the fires of 2012 and 2013, the Missouri River Floods of 2011 – which knocked out the Fort Calhoun nuclear plant – the super-tornadoes of 2013 – one with a two mile wide contact point on land, which tore through Oklahoma (CNN / National Geographic / Zerohedge) is will we survive to make the transition to clean sustainable energy?

or rather:

  1. “How many of us survive to make this transition?”
  2. “What will be the carrying capacity of earth for humans?”

The data are summarized beginning in Table 1, below.

Continue reading

Sustainable Investing: Green Energy, Green Economy

PLEP_13.10.18

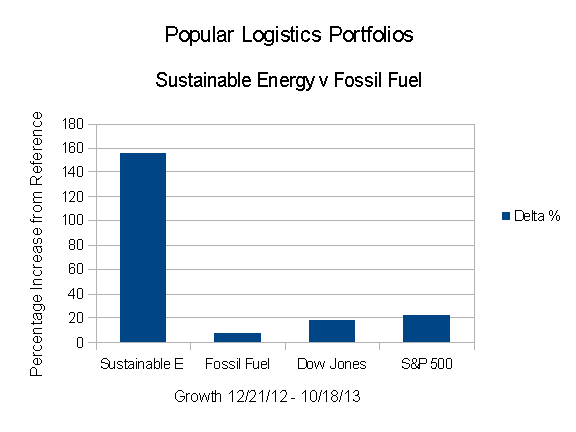
On Dec. 21, 2012, with $16 Imaginary Million, I created an investment simulation. I invested $1.0 Million in imaginary money in each of eight fossil fuel companies and eight sustainable energy companies. As of the close of trading 10 months later, Friday, Oct. 18, 2013, the trend, clearly evident after three months, in March of this year, continues.

  • The Dow Jones Industrial Average is up 17.64% from 12/21/12.
  • The S&P 500 is up 22.03%.
  • The Fossil Fuel Portfolio, dramatically underperforming the reference indices, is up 7.47%.
  • The Popular Logistics Sustainable Energy portfolio is up 156.14%.

As discussed last month, in “Investing for the Future,” the important question is:  Is this a trend or a bubble?  As I wrote, I think it’s a trend.

Jeremy Grantham, the “G” in GMO, invests with the expectation that all things being equal, a company’s valuation tends toward their arithmetic mean values. (Note that Mr. Grantham has not been contacted for this study.) But note that disruptive technologies are, by definition, game changers. Disruptive tech alters the landscape. If you looked at the airline, automobile and railroad industries over the 20th Century, automobiles and airlines waxed while railroads waned.

The future may be similar for Fossil Fuels and Sustainable Energy. The Market Capitalization of the Fossil Fuel portfolio is $1.13 Trillion. The Market Capitalization of the Sustainable Energy Portfolio is $0.06 Trillion ($60 Billion).  The value of the companies of the Sustainable Energy portfolio is roughly 5.3% of the market capitalization of the companies of the Fossil Fuel portfolio. It can almost be described as a rounding error compared to the value of the Fossil Fuel portfolio. But if Mr. Grantham’s analysis is valid, and you aggregate the portfolios into one called “Energy” as opposed to a “Fossil Fuel” portfolio and a “Sustainable Energy” portfolio, then the shareholders of these various companies are in for an interesting few years.

Continue reading

Energy Portfolios – Investing for the Future

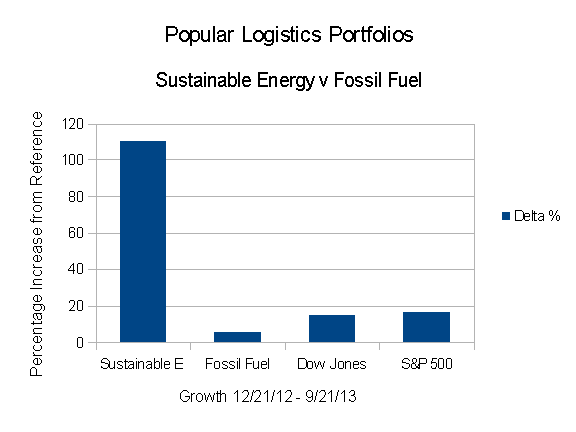
As of the close of trading Friday, Sept. 20, 2013, the trend, clearly evident by February 9, 2012 continues.

  • The Dow Jones Industrial Average is up 14.66% from 12/21/12.
  • The S&P 500 is up 16.36%.
  • The Fossil Fuel Portfolio, significantly underperforming the reference indices, is up 5.95%.
  • The Popular Logistics Sustainable Energy portfolio is up 110.10%.

PopLog.Port.13.09The important question is:  Is this a trend or a bubble?

I think it’s a trend. While I want to think it’s a trend, utility scale solar is at or below $4.00 per watt and getting cheaper.  Solar also scales from the 10 watts on a backpack to 10,000 watts or 10 KW on a rooftop to 500 million watts, 500 MW utilities are building. Wind is less expensive. Wind and solar are predictable. Continue reading

Popular Logistics Energy Portfolios – an Exercise in Climate Capitalism

Popular Logistics Energy Portfolios

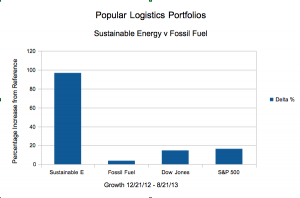
In December, 2012 I created two portfolios, a “Sustainable Energy” portfolio comprised of Cree, First Solar, GT Advanced Technology, Lighting Sciences, Next Era Energy, Sunpower Solar, Solazyme and Vestas, 8 stocks in the solar, LED lighting, wind and biofuel sectors, and a “Fossil Fuel” portfolio, comprised of BP, Chevron Texaco, Conoco Philips, Exxon Mobil, RD Shell, Haliburton, Transocean, and Peabody Coal, 8 stocks in the coal, oil, and fracking sectors. The results, after eight months, as illustrated above:

The Sustainable Energy portfolio, is now up 96.55%
The Reference Fossil Fuel portfolio is up 3.78%
The Dow Jones Industrial Average is up 14.66%
The S&P 500 is up 16.36%.

In a trend clearly evident in February, the Sustainable Energy portfolio has significantly outperformed the Dow Jones Industrials and the S&P 500, and the Fossil Fuel portfolio, which has significantly underperformed the indices.

These data are summarized in table 1 and below.

Summary Data
Portfolio 12/21/12 08/21/13 Delta %
Sustainable Energy $8,000,000 $15,724,266 $7,724,266 96.55%
Fossil Fuel $8,000,000 $8,302,069 $302,069 3.78%
DJI 13,091 15,010 1,919 14.66%
S&P 500 1,430 1,664 234 16.36%
Table 1

The details are below the fold.

Continue reading

Announcing the Popular Logistics Virtual Portfolio in Information Technology

Hot on the heels of the December 21, 2012 launch of the Popular Logistics Virtual Portfolio in Sustainable Energy, here, up 22.36%, I am announcing the launch of the Popular Logistics Virtual Portfolio in Information Technology. Roughly $1.0 million in Apple, Google, HP, IBM, Intel, Microsoft, and Oracle.(Their investor relations pages are AppleGoogle, HPIBM, Intel, Microsoft, and Oracle.)


Tech Virtual Portfolio
Item Stock Price Shares Total
1 Apple $446 2,242 $1,000,000
2 Google $795 1,258 $1,000,000
3 HP $17 59,559 $1,000,000
4 IBM $198 5,051 $1,000,000
5 Intel $20 50,000 $1,000,000
6 Microsoft $27 37,037 $1,000,000
7 Oracle $24 41,667 $1,000,000
total $7,000,000
Table 1. Acquisitions, Start of Business, 2/22/13

Generally speaking, here’s what I expect:

  • Apple, IBM: I expect to significantly outperform the Dow Jones and S&P 500.
  • Google: I expect to perform in line with the Dow Jones and S&P.
  • HP: An investment in HP is speculative. Whitman may turn the company around. The stock might wildly outperform the Dow & the S&P. As Gerstner might say, however, it’s hard to teach an elephant to dance. The stock may plummet.
  • Intel, Oracle, I don’t know enough to have an expectation.
  • Microsoft may become a leading indicator of the economy.  Thus, if the S&P does well, Microsoft may do better.

These are in table 2, below

Continue reading

Apple at $665 per share – or $705 – or $1077

space-apple-logo

Apple, if it can be compared to Google, IBM, Intel, Microsoft, and Oracle, should be priced at 665 per share. This analysis is simply based on Stock Price, Earnings per Share (EPS) and the Price Earnings ratio. or P/E. The average P/E of these companies is 15.08. If Apple’s stock was 15.08 times earnings, it would be 665. If you take Apple out of the mix, the average P/E becomes 16.01. At 16.01 times earnings, Apple’s stock price would be 705. And if priced like Google, $1077. Continue reading

Popular Logistics Sustainable Energy Portfolio

Earth from Space

Popular Logistics announces the Popular Logistics Sustainable Energy Portfolio Simulation.

This portfolio is composed of companies in the solar, biofuel and LED lighting industries.

I think these are disruptive technologies, like personal computers and workstations and client server software architecture in the 1980s and aircraft in the mid-20th and automobiles in the early 20th Century. We may be approaching, or may have recently crossed a “tipping point” in the Wind, Solar, LED lighting and Bio Fuel industries.

As points of reference, this “Sustainable Energy Portfolio” will be compared to an “UnSustainable Energy Portfolio,”  composed of oil industry stocks, and the Dow Jones Industrial Average and the S&P 500.

Continue reading

Solar Power & Electric Utilities: Is The Paradigm Shifting?

Ground Mounted Array.

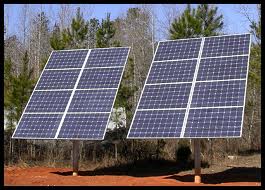
The 16-module solar array pictured above was built in 2005.  It probably has 2.5 Kilowatt (KW) to 2.8 KW of nameplate capacity. In New Jersey, residential solar systems range from 3 KW to 30 KW. Most are between 4 and 10 KW. Commercial systems range from 8KW to 200 KW. Utility scale systems are in the 10 Mega Watt (MW) to 550 MW range. In 2005, the costs for small scale residential systems were around $8.50 / watt, exclusive of any incentives. Today it is probably around half that, and cheaper for the larger utility scale systems. 1.0 MW system would require 4,000 modules of 250 watts each. The system pictured above requires about 50 square feet of land.As illustrated by the photo of the Topaz array, below, a 550 MW system, like Topaz, would require 2.2 million modules, and would cover a lot of ground.

First Solar Topaz

First Solar, FSLR, a $2.8 Billion company, and Sunpower, SPWR, an $840 Million company, two of the pillars of what is left of the American solar energy industry, made some interesting statements in their 2011 annual reports: Continue reading

Sustainable Investing, Value Investing & Speculation

Earth from Space

Investing for Sustainable Value – changing the paradigm – is critical – because we only have one earth.

This post suggests that investing in Cree, the Ford Motor Company, GT Advanced Technologies, Lighting Sciences, and Solazyme, are investments in companies that are shifting the paradigm toward sustainability. Investments in Cree, Lighting Sciences and Solazyme appear speculative at this time. Investments in Ford and GT Advanced Technologies appear to be “value” investments with significant margins of safety.

Sustainable development is that which meets the needs of the present generation without compromising the abilities of future generations to meet their needs.” This canonical definition was offered in “Our Common Future,” a report to the United Nations by the Brundland Commission in 1987. Report here, see also wikipedia. “Sustainable Investing,” according to Krosinsky and Robins, is “an approach to investing driven by the long-term economic, environmental and social risks and opportunities facing the global economy.” Continue reading

Apple & Blackberry – Yesterday, Today, & Tomorrow

Blackberry 850 - 2-way messagingBack in 1999, I was walking down a hall to the data center of a US Navy base in Virginia, when I noticed a sign that said “Cell Phones Prohibited. Deadly Force Is Authorized in this Area.” Fortunately my cellphone didn’t ring.

One of my colleagues had an Apple Newton. Just as the Osborne and Kaypro led to the Compaq and the laptops, PDAs running the Newton operating system and PDAs from Go Computers led to the Palm Pilot, and ultimately to the iPod, iPhone, and iPad, but that’s another story.

Research In Motion had just introduced the Blackberry 850 handheld. My colleagues in the financial industry had them. I understood the potential and wanted one. That too is another story.


Continue reading

Facebook IPO: The Sound of Bubbles Popping

Soap Bubble

Soap Bubble, by Irfan Mirza

 Facebook went public on Friday, May 18, 2012. Trading for FB opened at $42.025 per share, giving the company a market capitalization of $72.76 Billion. However, Facebook closed it’s first day as a publicly traded stock down 9.3% at $38.105 per share. On it’s second day, Monday, May 21, it opened at $36.53 per share and closed at $34.03 per share, dropping another 6.8%, and 19% from the opening price. It’s sliding is raising eyebrows in the financial media (Business Week, Chicago Tribune, Reuters).

A Bubble Popping, by Richard Heeks

Bubble Pop, by Richard Heeks

But the question may be less “Why is Facebook’s stock price dropping?” or “Who’s to blame?” than “What should be it’s price?

GMO‘s Jeremy Grantham talks about “Reversion to the Mean.” The mean, however, for a stock with 2 days of history is not statistically meaningful. So I compared it to Apple, Google, IBM, Microsoft, and Oracle, pulling data off of the Internet at Finance.Google.Com after the close of trading on Monday, May 21, 2012.

(Image Links: Soap Bubble & Bubble Pop)

Continue reading

Is Ford Motor Co Sustainable? And is Ford a Value Investment?

Ford Fusion

Ford Fusion, available as a hybrid

Back in October, 2007, I wrote about the Toyota Prius and the GM Hummer in Prius v Hummer, the Battle for the Streets and the Prius v Hummer, the Battle for the Brains. (Spoiler alert – the Prius won). Now I’m thinking about Ford Motor Company. A few years back their tag line was “Ford Has A Better Idea.” That may not be the current tag line, but I think it is the case. I will go further and say that Ford is on the road to being  Sustainable car company, and is a Value Investment.

While Toyota deserves credit for developing the hybrid- the Prius was introduced in 2000 – Ford has an extensive lineup of hybrids and is putting the EcoDrive – which boosts mileage by 20% – on vehicles, from small cars to the F150 truck. And 40% of the F150′s sold today are sold with the EcoDrive engine. Continue reading