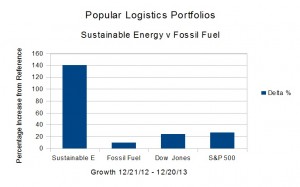
 The Dow Jones Industrial Average is up 26.29% from 12/21/12.
The S&P 500 is up 32.03%.
The Fossil Fuel Portfolio is up 18.52% from Dec. 21, 2012.
The Sustainable Energy Portfolio is up 211.6% from Dec. 21, 2012. Continue reading
Tag Archives: Sustainable Investing
Energy Portfolios, 16 Months: Sustainable Energy up 204.25%, Fossil Fuel up 15.38%
 On Dec. 21, 2012, I put $16 Million imaginary dollars in equal imaginary investments in 16 real energy companies; Eight in the Sustainable Energy space and eight in the fossil fuel space. The results:
- The Dow Jones Industrial Average is up 24.54% from Dec. 21, 2012.
- The S&P 500 is up 30.56% from Dec. 21, 2012.
- The Fossil Fuel Portfolio had a great month, however, it continues to dramatically underperform the reference indices. It is up 15.38% from Dec. 21, 2012.
- The Sustainable Energy portfolio had a bad month, however, it continues to dramatically outperform the averages, and is up 204.25% from Dec. 21, 2012
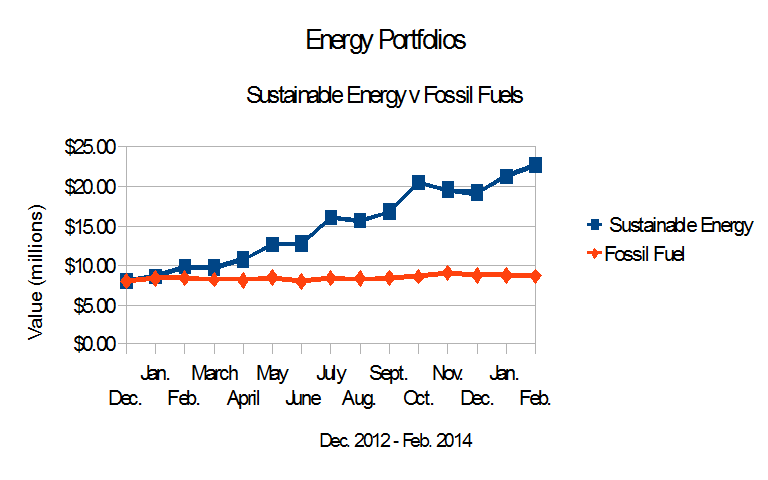
Energy Portfolios: 15 Months: Sustainable up 222.6%: Fossil Fuel up 7.3%

On Dec. 21, 2012, I put $16 Million imaginary dollars in equal imaginary investments in 16 real energy companies; Eight in the Sustainable Energy space and eight in the fossil fuel space. The Sustainable Energy portfolio is composed of Cree and Lighting Sciences in the LED space, GTAT, which at the time made solar ovens for cooking PV wafers, and today is diversifying, First Solar and Sunpower in the solar space, Vestas, a wind company, Solazyme a biofuel company and Next Era, a utility. The fossil fuel companies are the oil companies BP, Chevron Texaco, Conoco Phillips, Exxon Mobil and RD Shell, the coal company Peabody Coal, and Haliburton and Transocean, companies in the offshore oil and oil and gas drilling service industries.
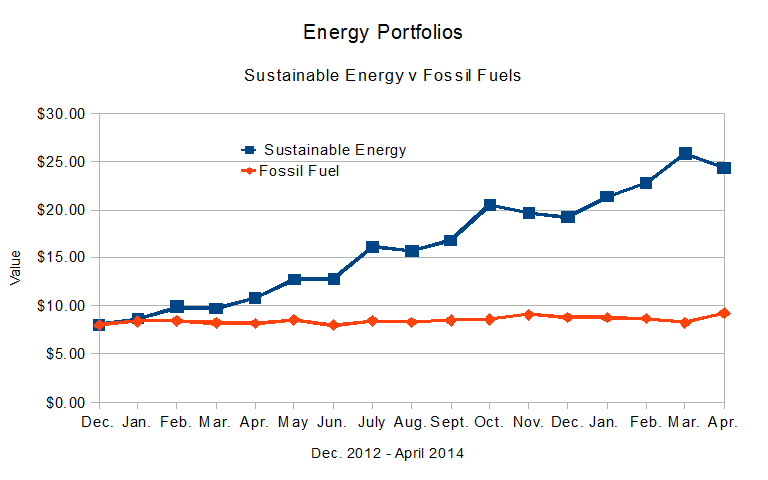
Energy Portfolios: 14 Months: Sustainable up 184.4%: Fossil Fuel up 8.7%
 The Dow Jones Industrial Average is up 23.01% from 12/21/12 to 2/21/14.
- The S&P 500 is up 28.39%.
- The Fossil Fuel Portfolio continues to dramatically underperform the reference indices. It is up 8.7% from Dec. 21, 2012.
- The Sustainable Energy portfolio continues to dramatically outperform the averages, and is up 184.41% from Dec. 21, 2012.
Note that the Sustainable Energy portfolio does not include Solar City, SCTY, or Tesla Motors, TSLA. Solar City’s stock price is up 713.0%, from 10.73 on December 21, 2012 to 75.86 at the close of trading Feb. 21, 2014. Tesla is up 614.5% from 34 to 209.60.
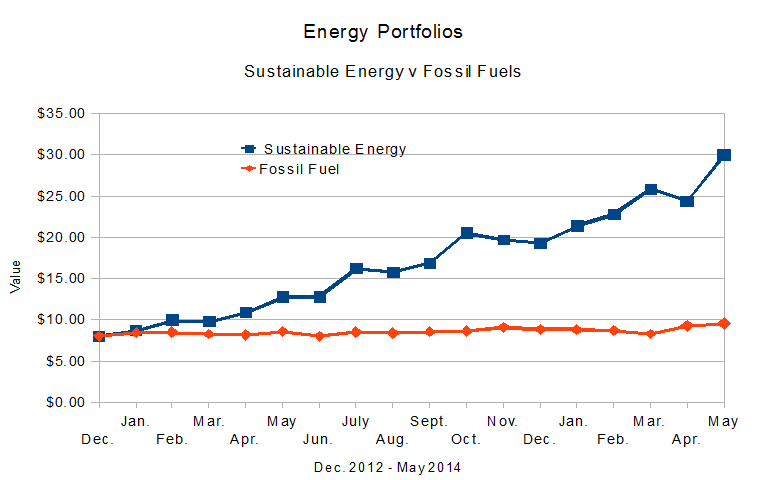
Energy Portfolios: 13 Months: Sustainable up 167.4%: Fossil Fuel up 8.92%
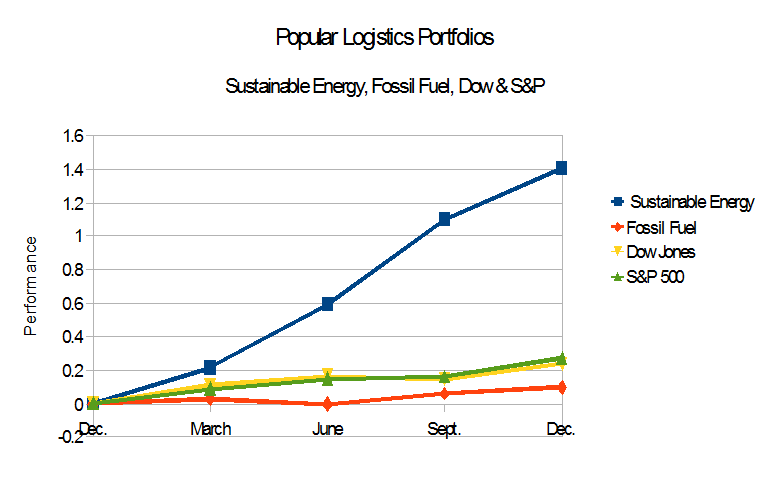
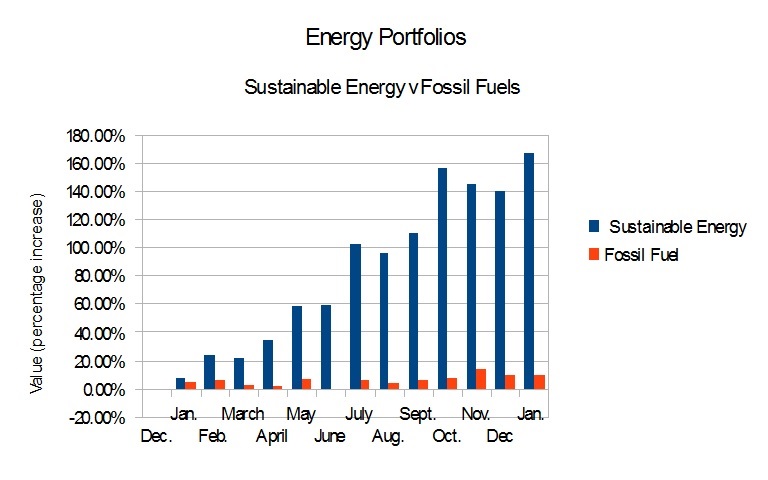 Figure 1, above, shows the relative performance of my hypothetical investments in sustainable Energy and Fossil Fuels, since Dec. 21., 2012.
- The Dow Jones Industrial Average is up25.38% from 12/21/12.
- The S&P 500 is up28.95%.
- The Fossil Fuel Portfolio continues to dramatically underperform the reference indices. It is up 9.44% from Dec. 21, 2012, and down slightly from Dec. 20, 2013.
- The Sustainable Energy portfolio continues to dramatically outperform the fossil fuel portfolio and the averages, and is up 167.37% from Dec. 21, 2012.
As described in the earlier posts in this series, in Dec., 2012, I read that MidAmerican Energy was buying large scale solar electric generating stations being built by First Solar and Sunpower, and being financed by GE. This got me thinking … Continue reading
Energy Portfolios & Reference Indices, 2013 Summary
If a picture is worth a thousand words …
here are two thousand words on Sustainable Investing in 2013.
While the data may suggest that a “correction” may be in progress for the “Sustainable Energy” portfolio, and while the actions or inactions of various governments can dramatically effect performance of these portfolios, the Sustainable Energy Portfolio outperformed the Dow Jones Industrials and the S&P 500, both of which outperformed the Fossil Fuel Portfolio.
As the professional say, “Past performance is no guarantee of future performance.”
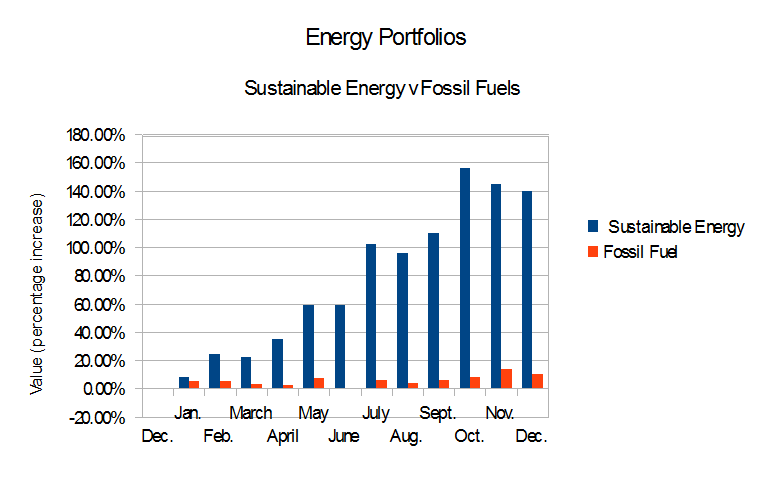
Energy Portfolios At One Year: Sustainable Energy up 140%, Fossil Fuel up 9.85%
On Dec. 21, 2011, reading that MidAmerican Energy was investing in utility scale solar energy generation, I looked at First Solar and Sunpower. Then I looked at six other companies in the sustainable energy world. I created a model portfolio. To make things interesting, I looked at eight companies in the fossil fuel industy and invested $16 Imaginary Million in these 16 companies, $1.0 Imaginary Million in each. As of the close of trading one year later, Friday, Dec. 20, 2013,
- The Dow Jones Industrial Average is up 23.91% from 12/21/12.
- The S&P 500 is up 27.13%.
- The Fossil Fuel Portfolio continues to dramatically underperform the reference indices. It is up 9.85% from Dec. 21, 2012.
- The Sustainable Energy portfolio continues to dramatically outperform the averages, and is up 140.31% from Dec. 21, 2012.
The data are summarized beginning in Table 1, below.
Energy Portfolios: Minor Corrections, Overall Results In Line with the Trend
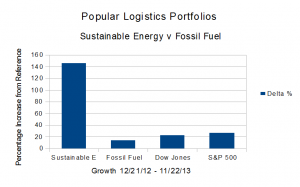 On Dec. 21, 2011, with $16 Imaginary Million, I created an investment simulation. I invested $1.0 Million in imaginary money in each of eight fossil fuel companies and eight sustainable energy companies. As of the close of trading 11 months later, Friday, Nov. 22, 2013, the trend, clearly evident after three months, in March of this year, continues.
- The Dow Jones Industrial Average is up 22.72% from 12/21/12.
- The S&P 500 is up 26.22%.
- The Fossil Fuel Portfolio, dramatically underperforming the reference indices, is up 13.37% from Dec. 21, 2012.
- The Sustainable Energy portfolio is up 145.37% from Dec. 21, 2012.
- The Sustainable Energy Portfolio is also down 4.39% from October 18, 2013.
Note that this represents a retreat of 4.39% from the high of 156.14%, in October, 2013.
As discussed in September and October, last month, in Septermber, 2013, in “Investing for the Future,” and October, in “Sustainable Investing: Green Energy, Green Economy,” the important question is: Is this a trend or a bubble? As I wrote, I think it’s a trend.
The 2,000 pound question, after Typhoon Haiyon, Hurricanes Sandy, Irene and Katrina, after the fires of 2012 and 2013, the Missouri River Floods of 2011 – which knocked out the Fort Calhoun nuclear plant – the super-tornadoes of 2013 – one with a two mile wide contact point on land, which tore through Oklahoma (CNN / National Geographic / Zerohedge) is will we survive to make the transition to clean sustainable energy?
or rather:
- “How many of us survive to make this transition?”
- “What will be the carrying capacity of earth for humans?”
The data are summarized beginning in Table 1, below.
Sustainable Investing: Green Energy, Green Economy
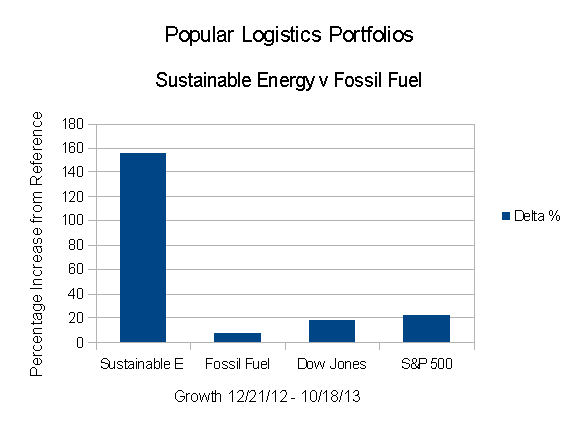
On Dec. 21, 2012, with $16 Imaginary Million, I created an investment simulation. I invested $1.0 Million in imaginary money in each of eight fossil fuel companies and eight sustainable energy companies. As of the close of trading 10 months later, Friday, Oct. 18, 2013, the trend, clearly evident after three months, in March of this year, continues.
- The Dow Jones Industrial Average is up 17.64% from 12/21/12.
- The S&P 500 is up 22.03%.
- The Fossil Fuel Portfolio, dramatically underperforming the reference indices, is up 7.47%.
- The Popular Logistics Sustainable Energy portfolio is up 156.14%.
As discussed last month, in “Investing for the Future,” the important question is: Is this a trend or a bubble? As I wrote, I think it’s a trend.
Jeremy Grantham, the “G” in GMO, invests with the expectation that all things being equal, a company’s valuation tends toward their arithmetic mean values. (Note that Mr. Grantham has not been contacted for this study.) But note that disruptive technologies are, by definition, game changers. Disruptive tech alters the landscape. If you looked at the airline, automobile and railroad industries over the 20th Century, automobiles and airlines waxed while railroads waned.
The future may be similar for Fossil Fuels and Sustainable Energy. The Market Capitalization of the Fossil Fuel portfolio is $1.13 Trillion. The Market Capitalization of the Sustainable Energy Portfolio is $0.06 Trillion ($60 Billion). The value of the companies of the Sustainable Energy portfolio is roughly 5.3% of the market capitalization of the companies of the Fossil Fuel portfolio. It can almost be described as a rounding error compared to the value of the Fossil Fuel portfolio. But if Mr. Grantham’s analysis is valid, and you aggregate the portfolios into one called “Energy” as opposed to a “Fossil Fuel” portfolio and a “Sustainable Energy” portfolio, then the shareholders of these various companies are in for an interesting few years.
Popular Logistics Energy Portfolios – an Exercise in Climate Capitalism
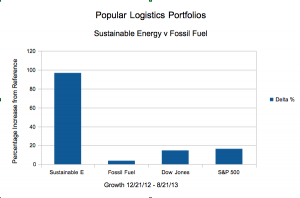
In December, 2012 I created two portfolios, a “Sustainable Energy” portfolio comprised of Cree, First Solar, GT Advanced Technology, Lighting Sciences, Next Era Energy, Sunpower Solar, Solazyme and Vestas, 8 stocks in the solar, LED lighting, wind and biofuel sectors, and a “Fossil Fuel” portfolio, comprised of BP, Chevron Texaco, Conoco Philips, Exxon Mobil, RD Shell, Haliburton, Transocean, and Peabody Coal, 8 stocks in the coal, oil, and fracking sectors. The results, after eight months, as illustrated above:
The Sustainable Energy portfolio, is now up 96.55%
The Reference Fossil Fuel portfolio is up 3.78%
The Dow Jones Industrial Average is up 14.66%
The S&P 500 is up 16.36%.
In a trend clearly evident in February, the Sustainable Energy portfolio has significantly outperformed the Dow Jones Industrials and the S&P 500, and the Fossil Fuel portfolio, which has significantly underperformed the indices.
These data are summarized in table 1 and below.
| Summary Data | ||||
| Portfolio | 12/21/12 | 08/21/13 | Delta | % |
| Sustainable Energy | $8,000,000 | $15,724,266 | $7,724,266 | 96.55% |
| Fossil Fuel | $8,000,000 | $8,302,069 | $302,069 | 3.78% |
| DJI | 13,091 | 15,010 | 1,919 | 14.66% |
| S&P 500 | 1,430 | 1,664 | 234 | 16.36% |
| Table 1 | ||||
The details are below the fold.
Popular Logistics Energy Portfolios: At 6 Months
After Six Months,
- The Sustainable Energy portfolio is up 61.78%
- The Reference Fossil Fuel portfolio is DOWN 0.39%
- The Dow Jones Industrial Average is up 16.49%
- The S&P 500 is up 14.76%.
These data are summarized in table 1 and discussed below the fold. Continue reading
Earth Day, 2013. Oil Spills, Explosions, Fracking Business As Usual & The Stock Market Response
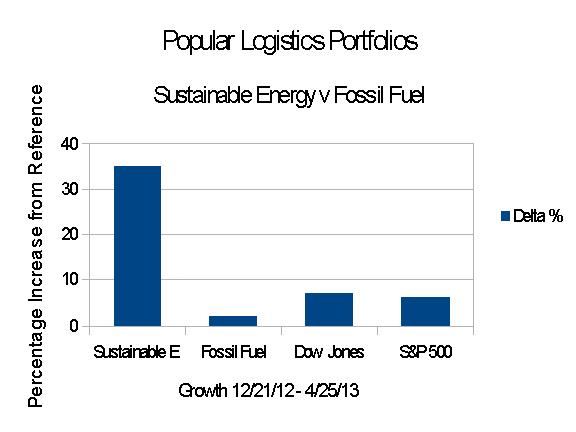
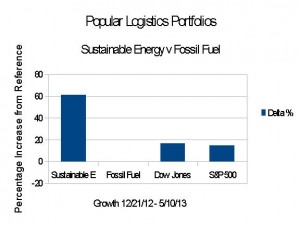
Wall St. NYC, April 26, 2013. Monday, April 22, 2013 was Earth Day. At the close of trading Thursday, April 25, 2013, as compared to my reference date of Dec. 21, 2012, the Dow Jones Industrials was up 12.3% , the S&P 500 closed up 10.84%, the “Popular Logistics Fossil Fuel Reference Portfolio was up 1.8% and the Popular Logistics Sustainable Energy portfolio was up 34.85%. (This is in line with the trend noted in my previous post, March 23, 2013., in the series that began Dec. 21, 2012.) And Shell Oil has temporarily suspended exploration and drilling operations in the Arctic. (Click here for Forbes). The stock portfolio data are summarized below, in Table 1. That’s the good news (unless you’re long on fossil fuels).
Here’s the bad news. “Fracking” is widespread and unregulated (click here). An oil spill dumped 500,000 gallons from Exxon pipeline onto Mayflower, Arkansas and into Lake Conway (click here). A fatal fire & explosion in West, Texas left 35 dead, probably including 16 firefighters and emergency responders (click here). A fire and multiple explosions on gasoline transport barges docked in Mobile, Alabama injured 3 (click here). Continue reading
Gold Bricks and Sink-Holes – The Risk & Reward of Fossil Fuel, Solar & Wind
 On Dec. 21, 2012, with virtual portfolios of 7 sustainable energy and 7 fossil fuel companies, I launched the Popular Logistics Sustainable Energy simulation, here.
On Feb. 8, 2013, after 6 weeks, after exercising virtual options to invest in 2 additional companies at 12/21/12 prices, I reported the results, here.
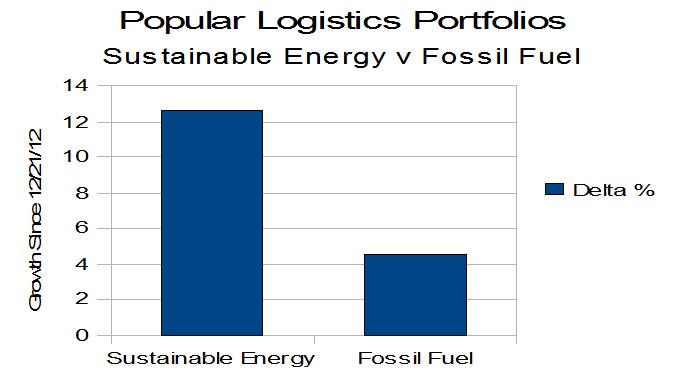
- The Sustainable Energy portfolio is up 12.6%
- The Fossil Fuel portfolio is up 5.09%.
- The Dow Jones Industrial Average is up 6.52%
- The S&P 500 is up 5.52%.
- The Sustainable Energy Portfolio is up significantly more than the Fossil Fuel Portfolio, and the major indices.
- The Fossil Fuel Portfolio is up, but lags the major indices.

These results are not that surprising. Continue reading
Nega-Watts, Nega-Fuel-Watts, Mega-Bucks
On Dec. 21, 2012, I launched the Popular Logistics Sustainable Energy Portfolio Simulation. After 6 weeks, as of the close of business 2/7/13, the results are:
- The Sustainable Energy Portfolio is UP 12.6%
- The Fossil Fuel Reference Portfolio is UP 5.09%
In comparison,
- The Dow Jones Industrial Average is UP 6.52%
- The S&P 500 is UP 5.52%
While six weeks is a very short time frame, except for fruit flies and Day Traders, the Popular Logistics Sustainable Energy Portfolio outperformed the Dow, the S&P 500, and the Fossil Fuel Reference Portfolio by a wide margin. In the same time frame the Fossil Fuel Reference Portfolio also underperformed these indices.
Details are below
Popular Logistics Sustainable Energy Portfolio

Popular Logistics announces the Popular Logistics Sustainable Energy Portfolio Simulation.
This portfolio is composed of companies in the solar, biofuel and LED lighting industries.
I think these are disruptive technologies, like personal computers and workstations and client server software architecture in the 1980s and aircraft in the mid-20th and automobiles in the early 20th Century. We may be approaching, or may have recently crossed a “tipping point” in the Wind, Solar, LED lighting and Bio Fuel industries.
As points of reference, this “Sustainable Energy Portfolio” will be compared to an “UnSustainable Energy Portfolio,” composed of oil industry stocks, and the Dow Jones Industrial Average and the S&P 500.