Category Archives: Finance

Energy Portfolios: Minor Corrections, Overall Results In Line with the Trend

PlPort_2013_11
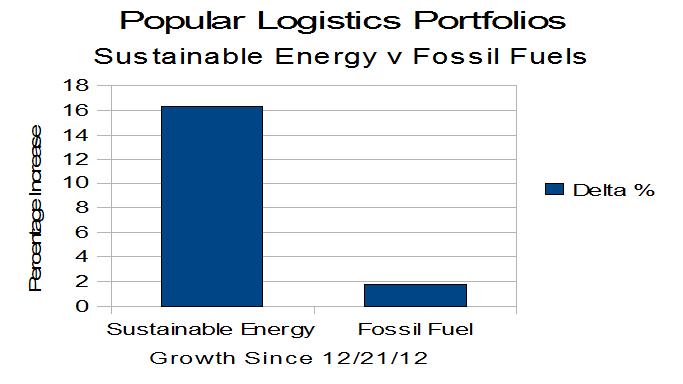
On Dec. 21, 2011, with $16 Imaginary Million, I created an investment simulation. I invested $1.0 Million in imaginary money in each of eight fossil fuel companies and eight sustainable energy companies. As of the close of trading 11 months later, Friday, Nov. 22, 2013, the trend, clearly evident after three months, in March of this year, continues.

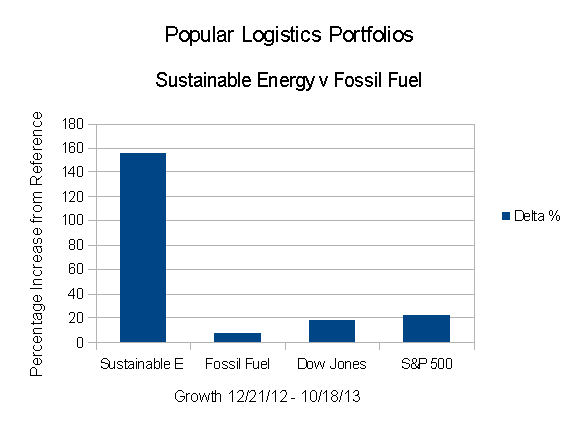
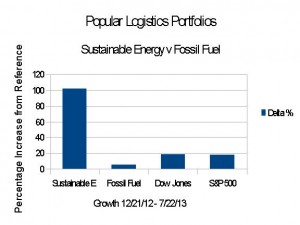
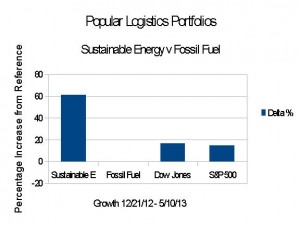
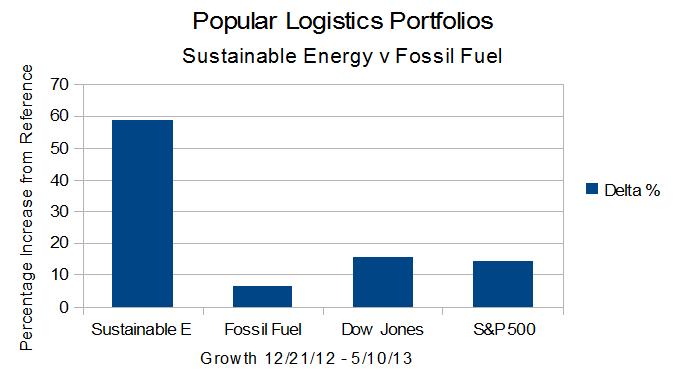
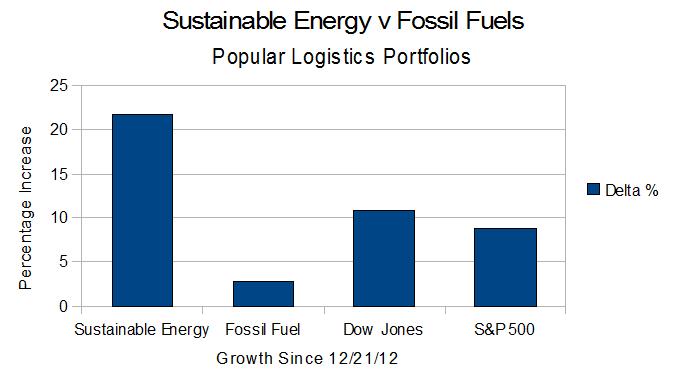
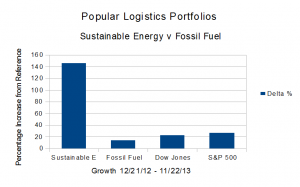
  • The Dow Jones Industrial Average is up 22.72% from 12/21/12.
  • The S&P 500 is up 26.22%.
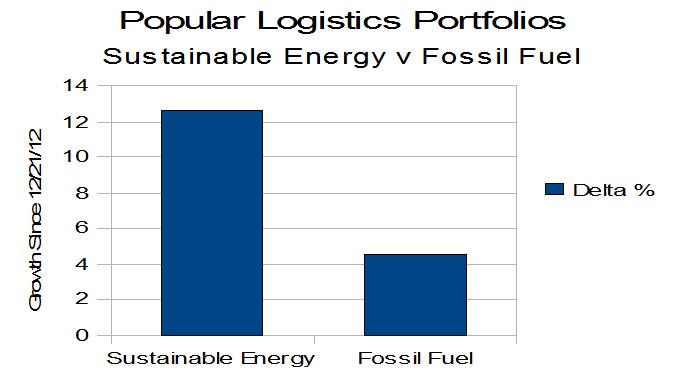
  • The Fossil Fuel Portfolio, dramatically underperforming the reference indices, is up 13.37% from Dec. 21, 2012.
  • The Sustainable Energy portfolio is up 145.37% from Dec. 21, 2012.
  • The Sustainable Energy Portfolio is also down 4.39% from October 18, 2013.

Note  that this represents a retreat of 4.39% from the high of 156.14%, in October, 2013.

As discussed in September and October, last month, in Septermber, 2013, in “Investing for the Future,” and October, in “Sustainable Investing: Green Energy, Green Economy,” the important question is:  Is this a trend or a bubble?  As I wrote, I think it’s a trend.

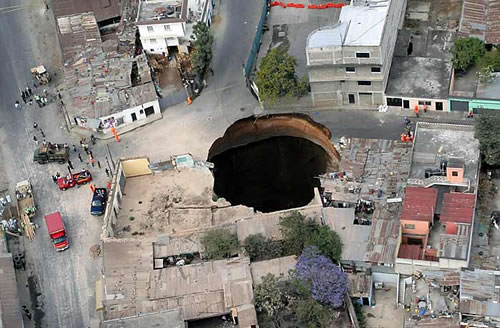
The 2,000 pound question, after Typhoon Haiyon, Hurricanes Sandy,  Irene and Katrina, after the fires of 2012 and 2013, the Missouri River Floods of 2011 – which knocked out the Fort Calhoun nuclear plant – the super-tornadoes of 2013 – one with a two mile wide contact point on land, which tore through Oklahoma (CNN / National Geographic / Zerohedge) is will we survive to make the transition to clean sustainable energy?

or rather:

  1. “How many of us survive to make this transition?”
  2. “What will be the carrying capacity of earth for humans?”

The data are summarized beginning in Table 1, below.

Continue reading

Sustainable Investing: Green Energy, Green Economy

PLEP_13.10.18

On Dec. 21, 2012, with $16 Imaginary Million, I created an investment simulation. I invested $1.0 Million in imaginary money in each of eight fossil fuel companies and eight sustainable energy companies. As of the close of trading 10 months later, Friday, Oct. 18, 2013, the trend, clearly evident after three months, in March of this year, continues.

  • The Dow Jones Industrial Average is up 17.64% from 12/21/12.
  • The S&P 500 is up 22.03%.
  • The Fossil Fuel Portfolio, dramatically underperforming the reference indices, is up 7.47%.
  • The Popular Logistics Sustainable Energy portfolio is up 156.14%.

As discussed last month, in “Investing for the Future,” the important question is:  Is this a trend or a bubble?  As I wrote, I think it’s a trend.

Jeremy Grantham, the “G” in GMO, invests with the expectation that all things being equal, a company’s valuation tends toward their arithmetic mean values. (Note that Mr. Grantham has not been contacted for this study.) But note that disruptive technologies are, by definition, game changers. Disruptive tech alters the landscape. If you looked at the airline, automobile and railroad industries over the 20th Century, automobiles and airlines waxed while railroads waned.

The future may be similar for Fossil Fuels and Sustainable Energy. The Market Capitalization of the Fossil Fuel portfolio is $1.13 Trillion. The Market Capitalization of the Sustainable Energy Portfolio is $0.06 Trillion ($60 Billion).  The value of the companies of the Sustainable Energy portfolio is roughly 5.3% of the market capitalization of the companies of the Fossil Fuel portfolio. It can almost be described as a rounding error compared to the value of the Fossil Fuel portfolio. But if Mr. Grantham’s analysis is valid, and you aggregate the portfolios into one called “Energy” as opposed to a “Fossil Fuel” portfolio and a “Sustainable Energy” portfolio, then the shareholders of these various companies are in for an interesting few years.

Continue reading

Real Shutdown Increases Real Unemployment by 800,000 Real Americans. Unofficially: Unemployment Rate Now 7.82%. Actually: 1.8 Million Unemployed by Shutdown; Rate of 8.48%

Pres. Obama & Speaker Boehner

Old Picture of President Obama & Speaker Boehner

The NY Times Editorial Board describes the shutdown, here, as “John Boehner’s Leadership Failure.” USA Today wrote, here,

“This shutdown, the first in 17 years, isn’t the result of two parties acting equally irresponsibly. It is the product of an increasingly radicalized Republican Party, controlled by a disaffected base that demands legislative hostage-taking in an effort to get what it has not been able to attain by the usual means: winning elections.”

On Saturday Night Live, Saturday, 10/5/13, Miley Cyrus and the cast mock-umented the GOP celebration over the shutdown with “We Can Stop (The Government).

But Art and Politics aside, what are the effects of the Shutdown on the Economy?

The Government Shutdown increased Unemployment by 1.8 million, the Unemployment Rate increased 16.2%,  from 7.31% on August 31, 2013 to 8.48% on October 2, 2013.  At the same time, GDP growth dropped 20%, from 2.5% to 2.0%. 

Continue reading

Energy Portfolios – Investing for the Future

As of the close of trading Friday, Sept. 20, 2013, the trend, clearly evident by February 9, 2012 continues.

  • The Dow Jones Industrial Average is up 14.66% from 12/21/12.
  • The S&P 500 is up 16.36%.
  • The Fossil Fuel Portfolio, significantly underperforming the reference indices, is up 5.95%.
  • The Popular Logistics Sustainable Energy portfolio is up 110.10%.

PopLog.Port.13.09The important question is:  Is this a trend or a bubble?

I think it’s a trend. While I want to think it’s a trend, utility scale solar is at or below $4.00 per watt and getting cheaper.  Solar also scales from the 10 watts on a backpack to 10,000 watts or 10 KW on a rooftop to 500 million watts, 500 MW utilities are building. Wind is less expensive. Wind and solar are predictable. Continue reading

Popular Logistics Energy Portfolios – an Exercise in Climate Capitalism

Popular Logistics Energy Portfolios

In December, 2012 I created two portfolios, a “Sustainable Energy” portfolio comprised of Cree, First Solar, GT Advanced Technology, Lighting Sciences, Next Era Energy, Sunpower Solar, Solazyme and Vestas, 8 stocks in the solar, LED lighting, wind and biofuel sectors, and a “Fossil Fuel” portfolio, comprised of BP, Chevron Texaco, Conoco Philips, Exxon Mobil, RD Shell, Haliburton, Transocean, and Peabody Coal, 8 stocks in the coal, oil, and fracking sectors. The results, after eight months, as illustrated above:

The Sustainable Energy portfolio, is now up 96.55%
The Reference Fossil Fuel portfolio is up 3.78%
The Dow Jones Industrial Average is up 14.66%
The S&P 500 is up 16.36%.

In a trend clearly evident in February, the Sustainable Energy portfolio has significantly outperformed the Dow Jones Industrials and the S&P 500, and the Fossil Fuel portfolio, which has significantly underperformed the indices.

These data are summarized in table 1 and below.

Summary Data
Portfolio 12/21/12 08/21/13 Delta %
Sustainable Energy $8,000,000 $15,724,266 $7,724,266 96.55%
Fossil Fuel $8,000,000 $8,302,069 $302,069 3.78%
DJI 13,091 15,010 1,919 14.66%
S&P 500 1,430 1,664 234 16.36%
Table 1

The details are below the fold.

Continue reading

Popular Logistics Energy Portfolios. Sustainable Energy Doubles. Fossil Fuels increase by 5.4%

PLEP_13.7.22

In December, 2012 I created two portfolios, a “Sustainable Energy” portfolio comprised of 8 stocks in the solar, LED lighting, wind and biofuel sectors, and a “Fossil Fuel” portfolio, comprised of 8 stocks in the coal, oil, and fracking sectors. The results, after seven months, as illustrated above:

The Sustainable Energy portfolio more than doubled: it is up 101.77%
The Reference Fossil Fuel portfolio is up 5.4%
The Dow Jones Industrial Average is up 18.75%
The S&P 500 is up 18.6%.

The Sustainable Energy portfolio has significantly outperformed the Dow Jones Industrials and the S&P 500 and the Fossil Fuel portfolio.

These data are summarized in table 1 and below. Continue reading

Popular Logistics Energy Portfolios: At 6 Months

PLEnergyPort

After Six Months,

  • The Sustainable Energy portfolio is up 61.78%
  • The Reference Fossil Fuel portfolio is DOWN 0.39%
  • The Dow Jones Industrial Average is up 16.49%
  • The S&P 500 is up 14.76%.

These data are summarized in table 1 and discussed below the fold. Continue reading

Popular Logistics Energy Portfolios: The Trend Continues.


Popular Logistics Energy Portfolios

The trend is clear – if 4 1/2 months is enough to establish a trend – the Sustainable Energy portfolio is up 58.78% from 12/21/12 while the Fossil Fuel portfolio is only up 6.71%. The Dow is up 15.49% and the S&P 500 is up 14.24% in that same period.

Is it because Atmospheric Carbon Dioxide has reached 400 PPM? (NPR / NY Times) Is Wall Street reacting because Goldman Sachs and JP Morgan, and other investment banks and hedge funds are hiring analysts from Greenpeace or people like me with MBAs in Sustainability from Marlboro, the Presidio, and the Bainbridge Institute? Continue reading

Energy Portfolios At 3 Months: Sustainable Energy: Up 22%. Fossil Fuels: Up 3%

PopLog_EPort.130322

As of the close of trading on March 22, 2013, excluding the effects of dividends, the Sustainable Energy reference portfolio I created on 12/21/12 is up 21.67%, from $8.0 Million to $9.73 Million. Excluding the effects of dividends, the Fossil Fuel Reference Virtual Portfolio is up 2.7%, from $8.0 Million to $8.221 Million in the same time frame. The Dow Jones Industrial Average is up 10.85% and the S&P 500 is up 8.88%.  Note that this is a simulation.  Note also that this doesn’t take into account the effects of dividends.

Continue reading

Sustainable Energy Portfolio UP 16% & Fossil Fuel Portfolio Up 1.7% – Dec.21, 2012 to March 1, 2013

E_Portfolios.130301

As of the close of trading on March 1, 2013, the virtual portfolio I created in Sustainable Energy stocks on 12/21/12 is up $1.3 Million, 16.31%, from $8.0 Million to $9.3 Million. The Fossil Fuel Reference Virtual Portfolio is up 1.71%, from $8.0 Million to $8.137 Million in the same time frame. The Dow Jones Industrial Average is up 7.63% and the S&P 500 is up 6.15%.

Continue reading

Announcing the Popular Logistics Virtual Portfolio in Information Technology

Hot on the heels of the December 21, 2012 launch of the Popular Logistics Virtual Portfolio in Sustainable Energy, here, up 22.36%, I am announcing the launch of the Popular Logistics Virtual Portfolio in Information Technology. Roughly $1.0 million in Apple, Google, HP, IBM, Intel, Microsoft, and Oracle.(Their investor relations pages are AppleGoogle, HPIBM, Intel, Microsoft, and Oracle.)


Tech Virtual Portfolio
Item Stock Price Shares Total
1 Apple $446 2,242 $1,000,000
2 Google $795 1,258 $1,000,000
3 HP $17 59,559 $1,000,000
4 IBM $198 5,051 $1,000,000
5 Intel $20 50,000 $1,000,000
6 Microsoft $27 37,037 $1,000,000
7 Oracle $24 41,667 $1,000,000
total $7,000,000
Table 1. Acquisitions, Start of Business, 2/22/13

Generally speaking, here’s what I expect:

  • Apple, IBM: I expect to significantly outperform the Dow Jones and S&P 500.
  • Google: I expect to perform in line with the Dow Jones and S&P.
  • HP: An investment in HP is speculative. Whitman may turn the company around. The stock might wildly outperform the Dow & the S&P. As Gerstner might say, however, it’s hard to teach an elephant to dance. The stock may plummet.
  • Intel, Oracle, I don’t know enough to have an expectation.
  • Microsoft may become a leading indicator of the economy.  Thus, if the S&P does well, Microsoft may do better.

These are in table 2, below

Continue reading

Apple at $665 per share – or $705 – or $1077

space-apple-logo

Apple, if it can be compared to Google, IBM, Intel, Microsoft, and Oracle, should be priced at 665 per share. This analysis is simply based on Stock Price, Earnings per Share (EPS) and the Price Earnings ratio. or P/E. The average P/E of these companies is 15.08. If Apple’s stock was 15.08 times earnings, it would be 665. If you take Apple out of the mix, the average P/E becomes 16.01. At 16.01 times earnings, Apple’s stock price would be 705. And if priced like Google, $1077. Continue reading

Gold Bricks and Sink-Holes – The Risk & Reward of Fossil Fuel, Solar & Wind


3 Gold-BrickOn Dec. 21, 2012, with virtual portfolios of 7 sustainable energy and 7 fossil fuel companies, I launched the Popular Logistics Sustainable Energy simulation, here.

On Feb. 8, 2013, after 6 weeks, after exercising virtual options to invest in 2 additional companies at 12/21/12 prices, I reported the results, here.

  • The Sustainable Energy portfolio is up 12.6%
  • The Fossil Fuel portfolio is up 5.09%.
  • The Dow Jones Industrial Average is up 6.52%
  • The S&P 500 is up 5.52%.
  • The Sustainable Energy Portfolio is up significantly more than the Fossil Fuel Portfolio, and the major indices.
  • The Fossil Fuel Portfolio is up, but lags the major indices.


Guatemala-Sinkhole

These results are not that surprising. Continue reading

Nega-Watts, Nega-Fuel-Watts, Mega-Bucks

 PopLog4


On Dec. 21, 2012, I launched the Popular Logistics Sustainable Energy Portfolio Simulation. After 6 weeks, as of the close of business 2/7/13, the results are:

  • The Sustainable Energy Portfolio is UP 12.6%
  • The Fossil Fuel Reference Portfolio is UP 5.09%

In comparison,

  • The Dow Jones Industrial Average is UP 6.52%
  • The S&P 500 is UP 5.52%

While six weeks is a very short time frame, except for fruit flies and Day Traders, the Popular Logistics Sustainable Energy Portfolio outperformed the Dow, the S&P 500, and the Fossil Fuel Reference Portfolio by a wide margin. In the same time frame the Fossil Fuel Reference Portfolio also underperformed these indices.

Details are below

Continue reading