If a picture is worth a thousand words …
here are two thousand words on Sustainable Investing in 2013.
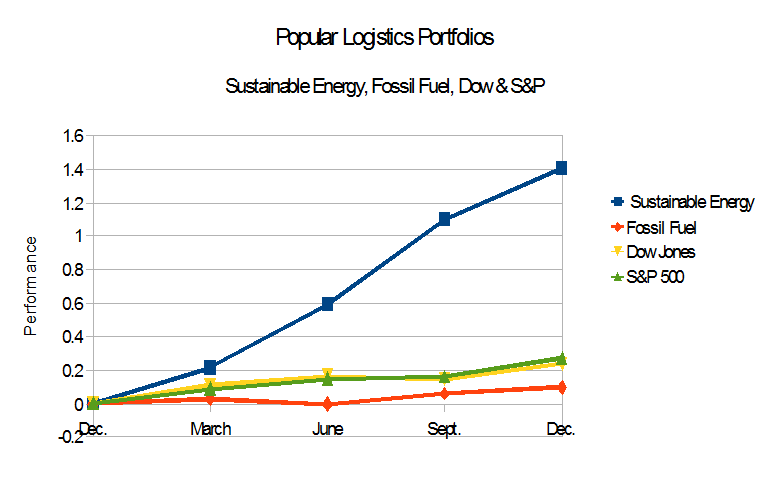
While the data may suggest that a “correction” may be in progress for the “Sustainable Energy” portfolio, and while the actions or inactions of various governments can dramatically effect performance of these portfolios, the Sustainable Energy Portfolio outperformed the Dow Jones Industrials and the S&P 500, both of which outperformed the Fossil Fuel Portfolio.
As the professional say, “Past performance is no guarantee of future performance.”
To those who suggest that the Sustainable Energy Portfolio is supported by government subsidies, please note that the fossil fuel industry is also supported by government subsidies.
Amory Lovins once said,
The least expensive unit of energy is the unit of energy you don’t need to buy,
the ‘NegaWatt.’
I have been saying,
The next least expensive unit of energy is the unit of energy that doesn’t need fuel,
the ‘Nega-Fuel-Watt.’
As I see it, the Sustainable Energy industries are transformative. Solar, wind, geothermal, LED lighting, biofuel today are like fossil fuel industry 50 or 100 years ago. We have already extracted and burned the coal, oil, and gas that was easy to extract. We extracted and burned so much coal, oil, and methane that we increased the concentration of Carbon Dioxide in the atmosphere from 310 ppm in 1960 to 400 ppm today – a 29% increase. We have put so much CO2 in the atmosphere that storms like Katrina, 2005, Irene, 2011, Sandy, 2012, and Hayon, 2013 are likely to be bigger, more powerful and more frequent.
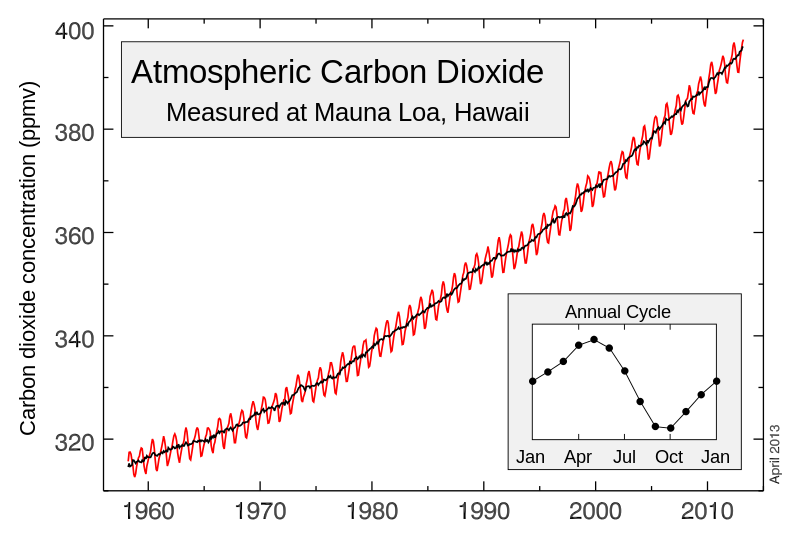
Keeling Curve. Atmospheric CO2 measured at Mauna Loa observatory
More on this in part 2, but first, back to the financial data….
Tables 1 and 2 show the relative performance of these portfolios at the end of 3-month period since the start of this experiment. Table 1 shows the increase or decrease in value of the portfolio against the Dow Jones Industrials and the S&P 500.
| Valuations | ||||
| Date | Sustainable Energy | Fossil Fuel | Dow Jones | S&P 500 |
| Millions | Millions | Industrials | ||
| Dec 21, 2012 | $8.00 | $8.00 | 13,091 | 1,430 |
| March 21, 2013 | $9.73 | $8.22 | 14,512 | 1,557 |
| June 21, 2013 | $12.75 | $7.97 | 15,250 | 1,641 |
| Sept. 21, 2013 | $16.81 | $8.48 | 15,400 | 1,745 |
| Dec. 21, 2013 | $19.23 | $8.79 | 16,221 | 1,818 |
| Table 1 – 2013 | ||||
Table 2 shows the increase in percentage terms. This is the basis for figure 2, above.
| Relative Performance – Percentage |
||||
| Date | Sustainable | Fossil | Dow Jones | S&P 500 |
| Dec. 21, 2012 | N/A | N/A | N/A | N/A |
| March 21, 2013 | 21.66% | 2.76% | 10.85% | 8.88% |
| June 21, 2013 | 59.33% | -0.39% | 16.49% | 14.76% |
| Sept. 21, 2013 | 110.09% | 5.95% | 14.66% | 16.36% |
| Dec. 21, 2013 | 140.31% | 9.85% | 23.91% | 27.13% |
| Table 2 – 2013. | ||||
I started this experiment Dec. 21, 2012 with 16 Imaginary Million invested equally in 8 companies in the Sustainable Energy and Fossil Fuel industries. The Fossil Fuel portfolio, comprised of BP, Chevron, Conoco Philips, Exxon Mobil, Royal Dutch Shell, Haliburton, Transocean, and Peabody Coal, has a market capitalization of roughly $1.125 Trillion. The Sustainable Energy portfolio, comprised of Cree, First Solar, GT Advanced Technology, Lighting Sciences, Next Era Energy, Sun Power , Solazyme, and Vestas has a market capitalization of $60 Billion.
The Market Capitalization of the companies in the Sustainable Energy Portfolio is less than 5.4% of the market capitalization of the companies in the Fossil Fuel portfolio, and less than 15% the size of Exxon Mobil, the single biggest company in the Fossil Fuel portfolio. But the companies in the Fossil Fuel portfolio are not growth companies. I see the sustainable energy industry as transformative. GE and Siemens, which are, I think, the world’s biggest wind turbine manufacturers would build – and have built – nuclear power plants. But they have customers for wind. They have no customers for nuclear. Utilities like Next Era and Mid-American Energy are not investing in solar energy because radical environmentalists have infiltrated their Boards of Directors. They are doing so because their management knows that solar offers predictable cash flows and produces energy with no fuel costs.
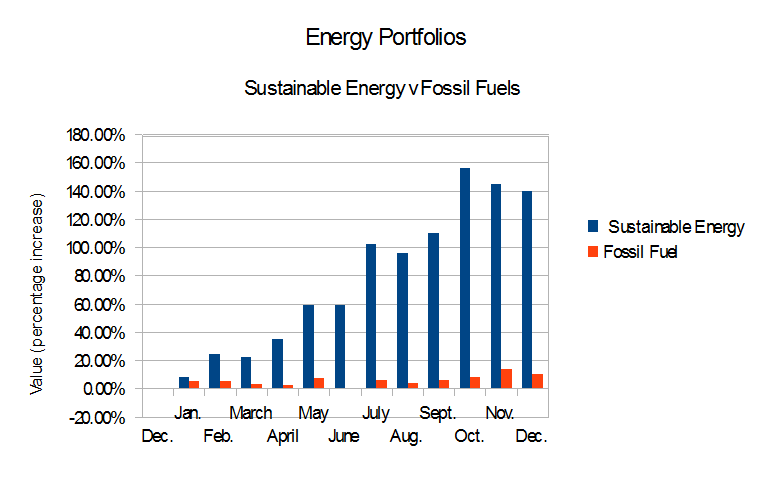
Table 3, below, shows the value of these portfolios over the course of the year.
| Portfolio Values | ||
| Date | Sustainable Energy | Fossil Fuel |
| Millions | Millions | |
| Dec., ’12 | $8.00 | $8.00 |
| Jan., ’13 | $8.63 | $8.35 |
| Feb., ’13 | $9.88 | $8.42 |
| March, ’13 | $9.73 | $8.22 |
| April, ’13 | $10.78 | $8.14 |
| May, ’13 | $12.70 | $8.54 |
| June, ’13 | $12.75 | $7.97 |
| July, ’13 | $16.14 | $8.43 |
| Aug., ’13 | $15.72 | $8.30 |
| Sept., ’13 | $16.81 | $8.48 |
| Oct., ’13 | $20.49 | $8.60 |
| Nov., ’13 | $19.63 | $9.07 |
| Dec., ’13 | $19.23 | $8.79 |
| Table 3 | ||
We know that burning carbon based fuels, moving carbon from below the surface of the earth into the atmosphere and the oceans has impacts. Some are considered accidental, one-of-a-kind events: the deaths of 11 men on the Deepwater Horizon and spill of 5.1 million barrels of oil in 2010 (here), the deaths, also in 2010, of 29 coal miners in a W. Virginia coal mine accident (here), the 2008 flood of 1.2 billion gallons of coal ash at the Kingston Steam Plant in Tennessee (here). Others are considered normal: acidification of the oceans, mountaintop removal, climate change, earthquakes, mercury in our food, toxins in our water, particulates in our air, drained and contaminated aquifers and an increased probability of earthquakes. These side-effects have been “externalized,” pushed away from the owners and operators of mines, wells and power plants and onto the taxpayers.
We have extracted and burned the coal, oil, and methane that is easy to extract. We are now seeing “grid” parity of electricity from new solar and new wind, as compared to old coal and old nuclear, without the externalized burden of fuel spills, security, waste management, lost ecosystem services and health effects.
The question is not “When will solar, wind, and geothermal displace fossil fuels and nuclear?” The question, as Jon Soroko elegantly put it, August 13, 2007, in “Canaries are to Coal Miners as Coal Miners are to ____________?” (here),
Canaries are to coal miners as coal miners are to the general population.
If we don’t care enough as a country about coal miners to make sure they’re safe – people in an exceptionally high-risk occupation – what does it say about the prospects for safety in the nation as a whole?
Life depends on clean air, clean water, and healthy food. We saw 650,000 people die in China in 2006 and 1.2 million people die in China in 2010 from air pollution. These data points, connected on a graph, suggest that 4.5 million died in China between January 1, 2005 and December 31, 2010 and 12.7 million to 14.2 million will have died from air pollution between Jan. 1, 2005 and 12/31/2015 (here).
We know that nega-watts and nega-fuel-watts are less expensive than their polluting alternatives. In other words, the question is:
“When will we act on this knowledge?”
–
Posts in this series
- L. Furman, 12/21/12, Popular Logistics Sustainable Energy Portfolio,
- L. Furman, 2/8/13, Nega-Watts, Nega-Fuel-Watts, Mega-Bucks,
- L. Furman, 2/9/13, Gold Bricks and Sink-Holes – The Risk & Reward of Fossil Fuel, Solar & Wind,
- L. Furman, 3/2/13, Sustainable Energy Portfolio UP 16% & Fossil Fuel Portfolio Up 1.7% – Since Dec.21, 2012..
- L. Furman, 3/23/13, Portfolio Simulation At 3 Months: Sustainable Energy: Up 22%. Fossil Fuels: 3%.
- L. Furman, 4/26/13, Earth Day, 2013. Oil Spills, Explosions, Fracking Business As Usual & The Stock Market Response
- L. Furman, 5/13/13, Popular Logistics Energy Portfolios: The Trend Continues.
- L. Furman, 6/24/13, Popular Logistics Energy Portfolios: At 6 months
- L. Furman, 7/22/13, Popular Logistics Energy Portfolios: Sustainable Energy Doubles. Fossil Fuels increase 5.4%
- L. Furman, 8/22/13, Popular Logistics Energy Portfolios: An Exercise in Climate Capitalism
- L. Furman, 9/20/13, Energy Portfolios – Investing for the Future
- L. Furman, 10/21/13, Sustainable Investing – Green Energy, Green Economy
- L. Furman, 11/22/13, Energy Portfolios: Minor Corrections, Overall Results In Line With the Trend
- L. Furman, 12/23/13, Energy Portfolios at One Year Sustainable Energy up 140%. Fossil Fuels up 9.85%.
- L. Furman, 12/26/13, Energy Portfolios and Reference Indices, 2013 Summary
–
I, Larry Furman, an analyst with Popular Logistics, hold a BS and an MBA, am available for consulting in various domains and can be reached at “lfurman97” at G Mail. My goal in these posts is to present and discuss phenomena which I find interesting and which appear indicative of systemic shifts in the economy. Investments in equities of various companies are risky. I do NOT hold a “Series 6” or “Series 7” license from the SEC or any similar licensing body. I am NOT a licensed stock broker, investment adviser or financial adviser and this should n0t be considered “Financial Advice” or “Investment Advice.”