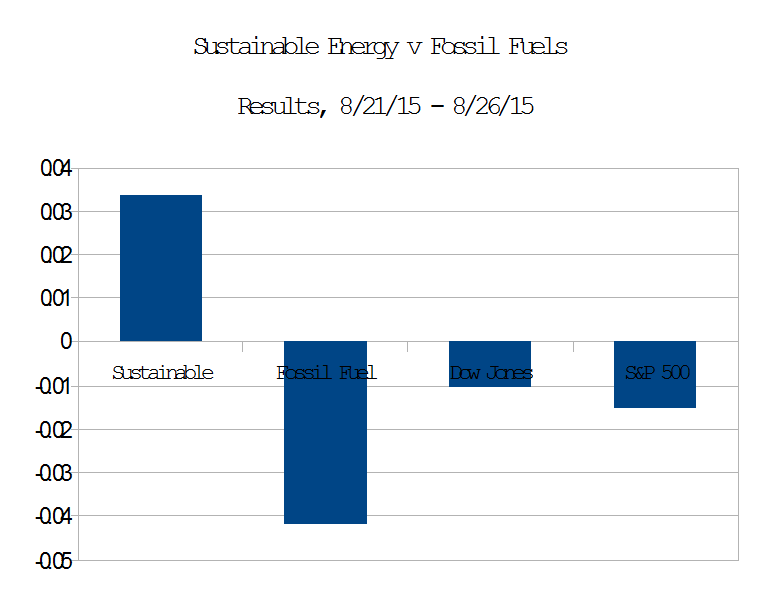
 According to Adam Haigh, Bloomberg Business the current stock market valuation “Correction” may be complete. Meanwhile, in the microeconomic world of energy, as illustrated above, the Sustainable Energy portfolio” I created in December, 2012, here, rose slightly above the close of trading Friday, August 21, 2015, while the Fossil Fuel portfolio, the S&P 500 index and the Dow Jones Industrial average closed below their values at the close of trading on 21 August, 2015.
Mr. Haigh, in Asian Stocks Rise as U.S. Equity Rout Halted; China Futures Gain, wrote,
Asian stocks rose for a second day after U.S. shares halted a six-day rout.
The MSCI Asia Pacific Index gained 0.9 percent to 127.93 as of 9:05 a.m. in Tokyo. The Standard & Poor’s 500 Index jumped 3.9 percent, the most since 2011. Two things that have supported U.S. stocks in the past, dovish words from the Federal Reserve and improved economic data, halted a plunge that erased $2.2 trillion from equity values.
But the long term trend in energy stocks, first reported by me here in February, 2013, appears to be persistent. Solar and Wind stocks may be continuing to climb; Fossil fuel stocks may be continuing to decline. Either or both of these trends could, of course, reverse.
The data are summarized beginning in Table 1, below.
| Summary Data | ||||||
| Portfolio | 12/21/12 | 08/21/15 | 08/26/15 | Delta | % | Annualized |
| Sustainable Energy | 8,000 | 16,208 | 16,749 | 8,749 | 109.36% | 41.01% |
| Fossil Fuel | 8,000 | 5,258 | 5,039 | -2,961 | -37.01% | -13.88% |
| DJI | 13,091 | 16,460 | 16,286 | 3,195 | 24.41% | 9.15% |
| S&P 500 | 1,430 | 1,971 | 1,941 | 511 | 35.73% | 13.40% |
| Portfolio valuation data in thousands | ||||||
| Table 1 | ||||||
The stock price data for the Sustainable Energy portfolio are in Table 2, below.
| Sustainable Energy Portfolio – Stock Prices | |||||||
| Item | Company | Symbol | 12/21/12 | 08/21/15 | 08/26/15 | Delta | Delta % |
| 1 | Cree | CREE | 34.0 | 25.5 | 25.7 | 0.21 | 0.83% |
| 2 | First Solar | FSLR | 31.0 | 45.5 | 46.1 | 0.62 | 1.36% |
| 3 | GT Adv. Tech. | GTAT | 3.0 | 0.1 | 0.1 | -0.01 | -10.78% |
| 4 | Lighting Science | LSCG | 0.8 | 0.2 | 0.2 | 0.01 | 6.45% |
| 5 | Next Era Energy | NEE | 70.0 | 107.0 | 101.6 | -5.33 | -4.98% |
| 6 | Sun Power | SPWR | 5.4 | 21.7 | 22.3 | 0.62 | 2.85% |
| 7 | Solazyme | SZYM | 8.3 | 2.1 | 2.2 | 0.13 | 6.19% |
| 8 | Vestas | VWS | 6.3 | 50.4 | 53.2 | 2.84 | 5.64% |
| Note that GTAT is currently in bankruptcy protection. | |||||||
| Table 2 | |||||||
The stock price data for the Fossil Fuel Portfolio are in Table 3, below.
| Fossil Fuel Portfolio – Stock Prices | |||||||
| Item | Company | Symbol | 12/21/12 | 08/21/15 | 08/26/15 | Delta | Delta % |
| 1 | BP | BP | 42.1 | 33.2 | 31.1 | -2.07 | -6.23% |
| 2 | Chevron Texaco | CVX | 109.7 | 75.8 | 73.1 | -2.68 | -3.54% |
| 3 | Conoco Philips | COP | 58.6 | 45.4 | 43.4 | -1.97 | -4.34% |
| 4 | Exxon Mobil | XOM | 87.2 | 72.1 | 72.5 | 0.42 | 0.58% |
| 5 | Royal Dutch Shell | RDS.A | 69.3 | 52.5 | 49.5 | -3.02 | -5.75% |
| 6 | Haliburton | HAL | 34.7 | 35.7 | 34.4 | -1.30 | -3.64% |
| 7 | Transocean | RIG | 45.6 | 12.8 | 11.6 | -1.19 | -9.30% |
| 8 | Peabody Coal | BTU | 26.4 | 1.8 | 1.5 | -0.25 | -14.12% |
| Table 3 | |||||||
As I wrote in “Gold Bricks and Sink Holes,” in February, 2013,
These results are not that surprising. Solar, Wind, Biofuel, and LED lighting are “growth” industries. Coal, oil, and oil service companies are in “mature” industries. As such I expect wide variability in the valuations of the solar, wind biofuel and LED lighting companies, and stable valuations in the fossil fuel space. However, just as the market capitalization of BP dropped by roughly 30% after the Deepwater Horizon catastrophe, the market capitalizations of fossil fuel companies, while insulated from long term effects of burning carbon, i.e. a changing climate, severe storms, and environmental effects generally, are subject to negative valuation pressures from acute events such as the BP/Transocean/Haliburton Deepwater Horizon disaster or the Shell Kulluk accident (Alaska Dispatch).
Royal Dutch Shell PLC spent $5.4 Billion since 2005 to drill in the Arctic (Reuters, 1/3/13). When Shell announced earnings for the Fourth Quarter of 2012, the company posted profits of $5.6 billion, 15% above Q4 2011, but 11.1% below Wall Street’s consensus estimates for the company. (Michelle Jones, ValueWalk, 1/31/13.)
The problem faced by the fossil fuel companies is that the oil, gas, and coal are deeper and dirtier. It’s not only “Peak Oil,” it’s Peak Oil, Peak Coal, and Peak Carbon, combined with Peak Population, Peak Water, and Climate Change. The fossil fuel companies must spend more to extract each BTU of energy from the ground. And society will have to pay more to deal with the consequences of burning all this carbon. We will see more storms like Katrina, 2005, Sandy, 2012, and Nemo, 2013, more accidents like the Deepwater Horizon and Kulluk, and more coal ash floods like the one in Kingston, Tennessee, 12/24/08.
These systems are fuel and waste based. When we burn fuel we harness some of the energy, and we also release waste into the biosphere. We also allow the coal, oil, and gas companies, or rather their shareholders, to pass on the “externalized” costs of dealing with the waste to society at large, and to our children and grandchildren. The profits declared by the executives of these companies are higher than they would be if clean-up costs would be taken into account.
The key to solar, wind, and marine hydro, what I call “Nega-Fuel-Watts”, is that they are not fuel and waste based. Rather, we place a widget in the path of a moving stream of particles, photons, air, or water, and harness some of the kinetic energy of those particles to generate electricity. Similarly, we can, using geothermal energy systems, harness the temperature differential between the surface of the earth and the crust of the planet to heat or cool our buildings, to run our industrial processes. Once the systems are in place they need to be maintained, but they don’t need fuel. Ongoing operations don’t create waste.
–
Posts in this series
- L. Furman, 12/21/12, Popular Logistics Sustainable Energy Portfolio
- L. Furman, 2/8/13, Nega-Watts, Nega-Fuel-Watts, Mega-Bucks
- L. Furman, 2/9/13, Gold Bricks and Sink-Holes – The Risk & Reward of Fossil Fuel, Solar & Wind
- L. Furman, 3/2/13, Sustainable Energy Portfolio UP 16% & Fossil Fuel Portfolio Up 1.7% – Since Dec.21, 2012
- L. Furman, 3/23/13, Portfolio Simulation At 3 Months: Sustainable Energy: Up 22%. Fossil Fuels: 3%
- L. Furman, 4/26/13, Earth Day, 2013. Oil Spills, Explosions, Fracking Business As Usual & The Stock Market Response
- L. Furman, 5/13/13, Popular Logistics Energy Portfolios: The Trend Continues.
- L. Furman, 6/24/13, Popular Logistics Energy Portfolios: At 6 months
- L. Furman, 7/22/13, Popular Logistics Energy Portfolios: Sustainable Energy Doubles. Fossil Fuels increase 5.4%
- L. Furman, 8/22/13, Popular Logistics Energy Portfolios: An Exercise in Climate Capitalism
- L. Furman, 9/20/13, Energy Portfolios – Investing for the Future
- L. Furman, 10/21/13, Sustainable Investing – Green Energy, Green Economy
- L. Furman, 11/22/13, Energy Portfolios: Minor Corrections, Overall Results In Line With the Trend
- L. Furman, 12/23/13, Energy Portfolios at One Year Sustainable Energy up 140%. Fossil Fuels up 9.85%
- L. Furman, 12/26/13, Energy Portfolios and Reference Indices, 2013 Summary.
- L. Furman, 1/22/14, Energy Portfolios: 13 Months, Sustainable Energy up 167.4%, Fossil Fuels up 9.44%
- L. Furman, 2/24/14, Energy Portfolios: 14 Months: Sustainable Energy up 184.4%, Fossil Fuels up 8.7%
- L. Furman, 3/23/14, Energy Portfolios: 15 Months: Sustainable Energy up 222.6, Fossil Fuel up 7.3%
- L. Furman, 4/22/14, Energy Portfolios, 16 Months: Sustainable Energy up 204.25%, Fossil Fuel up 15.38%
- L. Furman, 5/21/14, Energy Portfolios, 17 Months: Sustainable Energy up 211.6%, Fossil Fuels up 18.5%
- L. Furman, 6/24/14, Energy Portfolios, 18 Months: Sustainable Energy up 257%, Fossil Fuels up 24.6%
- L. Furman, 6/26/14, Energy Portfolios: 18 Months, Analysis
- L. Furman, 7/22/14, Energy Portfolios: 19 Months: Sustainable Energy up 222%, Fossil Fuels up 25%
- L. Furman, 8/23/14, Energy Portfolios: 20 Months: Sustainable Energy up 229%, Fossil Fuels up 18.4%
- L. Furman, 8/29 /14, Energy Portfolios: 20 Months: Conclusion & Observations
- L. Furman, 10/1/14, The Paradigm Is Shifting; Fossil Fuels Are Becoming Fossils
- L. Furman, 10/7/14, Cree: Strong Financials, But …
- L. Furman, 10/21/14, Energy Portfolios: 22 Months: Sustainable Energy Up But Dropping.
- L. Furman, 11/27/14, Energy Portfolios: 23 Months: Sustainable Energy DOUBLED, Fossil Fuel Down (slightly).
- L. Furman, 12/28/14, Energy Portfolios: 24 Months: Sustainable Energy Up 91%, Fossil Fuel DOWN 10%.
- L. Furman, 1/27/15, Energy Portfolios: 2 Years, 1 Month, Sustainable Up 85%, Fossil Fuels DOWN 15%
- L. Furman, 2/23/15, Energy Portfolios: 2 Years, 2 Months, Sustainable Up 109%, Fossil Fuels DOWN 12%.
- L. Furman, 3/21,15, Energy Portfolios, 2 Years 3 Months: Sustainable up 128%, Fossil Fuel DOWN 16%.
- L. Furman, 4/21/15, Energy Portfolios, 2 Years 4 Months: Sustainable up 138%, Fossil Fuel DOWN 12%.
- L. Furman, 5/21/15, Energy Portfolios, 2 Years 5 Months: Sustainable up 137%, Fossil Fuel DOWN 13.7%.
- L. Furman, 6/21/15, Energy Portfolios, 2 Years 6 Months: Sustainable up 128%, Fossil Fuel DOWN 18%.
- L. Furman, 7/23/15, Energy Portfolios, 2 Years 7 Months: Sustainable up 121%, Fossil Fuel DOWN 24%.
- L. Furman, 8/22/15, Energy Portfolios, 2 Years 8 Months: Sustainable up 102%, Fossil Fuel DOWN 34.3%.
- L. Furman, 8/26/15, Energy Portfolios and “The Correction“.
–
An analyst with Popular Logistics, I hold a BS and an MBA in “Managing for Sustainability” from Marlboro College, and over 20 years experience in Information Technology. Available as a speaker and consultant, I can be reached at “L Furman” at Popular Logistics . com”. Investments in equities are risky. I do NOT hold a Series 7 license from the SEC or any other corresponding credential from any other agency. I am NOT a licensed stock broker, investment adviser or financial adviser and this should n0t be considered “Financial Advice” or “Investment Advice.”