 On Dec. 21, 2012, I put $16 Million imaginary dollars in equal imaginary investments in 16 real energy companies; $8.0 in the Sustainable Energy space and $8.0 in the fossil fuel space. Excluding the value of dividends and transaction costs, but including the bankruptcy or crash of three companies in the sustainable energy space,
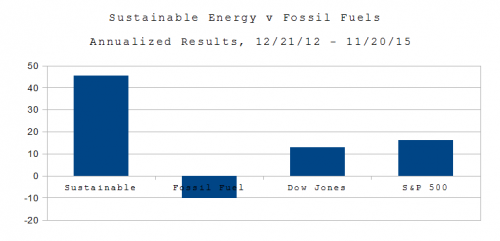
As of the close of trading on November 20, 2015:
- The Fossil Fuel portfolio was worth $5.63 Million, down 29.57% overall, down 10.44% on an annualized basis.
- The Sustainable Energy portfolio was worth $18.0 Million, up 129.50%, overall and 45.71% on an annualized basis.
- The Dow Jones Industrial Average is up 36.15% overall and 10.44% on an annualized basis, from 13,091 on 12/21/12 to close at 17,824 on 10/21/15.
- The S&P 500 is up 46.10% overall and 16.27% on an annualized basis, from 1,430 on 12/21/12 to close at 2,089 on 10/21/15.
It’s not a war on coal. It’s a paradigm shift.Think about it. We don’t use whale oil or kerosene for street lamps. We did, 100 years ago.
This of course, has geopolitical ramifications. It’s not just carbon dioxide, which is changing the climate and acidifying the oceans. Like Al Queda, Hamas and Hezbollah, ISIS finances its operations with petrodollars. (The difference is that Hamas is supported by Emirates and Kuwait, Hezbollah by Iran, Al Queda by our friends the Saudis, while ISIS has its own oil wells.) Earlier this year NJ’s Honorable Governor Chris Christie, a candidate for President, gave Exxon a $9 Billion gift (which is being challenged in the courts). BP was the beneficiary of the 1953 coup by the US under President Eisenhower and the UK which toppled the democratically elected government led by Prime Minister Mohammed Mossagedgh of Iran and propped up the Shah until the revolution in 1979. Shell has spent something like $12 Billion in failed attempts to drill the Arctic. BP, Transocean and Halliburton brought us the Deepwater Horizon; Halliburton also profited from the US Led war in Iraq.
The Sustainable Energy portfolio is composed of Cree (CREE) and Lighting Sciences (LSCG) in the LED space, GT Advanced Tech (GTAT), which at the time made solar ovens for cooking PV wafers. First Solar (FSLR) and Sunpower Corp. (SPWR) in the solar space, Vestas (VWSYF), a wind company, Solazyme (SZYM) a biofuel company and Next Era Energy (NEE), a utility.
The fossil fuel companies are the oil companies British Petroleum (BP), Chevron Texaco (CVX), Conoco Phillips (COP), Exxon Mobil (XOM) and RD Shell (RDS.A), the coal company Peabody Coal (BTU), and Haliburton (HAL) and Transocean (RIG), companies in the offshore oil and oil and gas drilling service industries.
The data are summarized beginning in Table 1, below.
| Summary Data | |||||
| Portfolio | 12/21/12 | 11/20/15 | Delta | % | Annualized |
| Sustainable Energy | 8,000,000 | 18,360,080 | 10,360,080 | 129.50% | 45.71% |
| Fossil Fuel | 8,000,000 | 5,634,690 | -2,365,310 | -29.57% | -10.44% |
| DJI | 13,091 | 17,824 | 4,733 | 36.15% | 12.76% |
| S&P 500 | 1,430 | 2,089 | 659 | 46.10% | 16.27% |
| Table 1 | |||||
The stock price data for the Sustainable Energy portfolio are in Table 2, below.
| Sustainable Energy Portfolio – Stock Prices | ||||||
| Item | Company | Symbol | 12/21/12 | 11/20/15 | Delta | Delta % |
| 1 | Cree | CREE | 34.0 | 25.7 | -8.34 | -24.53% |
| 2 | First Solar | FSLR | 31.0 | 45.4 | 14.44 | 46.58% |
| 3 | GT Adv. Tech. | GTAT | 3.0 | 0.2 | -2.78 | -92.60% |
| 4 | Lighting Science | LSCG | 0.8 | 0.1 | -0.61 | -81.33% |
| 5 | Next Era Energy | NEE | 70.0 | 101.0 | 31.02 | 44.31% |
| 6 | Sun Power | SPWR | 5.4 | 23.2 | 17.77 | 327.26% |
| 7 | Solazyme | SZYM | 8.3 | 3.0 | -5.34 | -64.03% |
| 8 | Vestas | VWS | 6.3 | 61.9 | 55.55 | 880.35% |
| Note that GTAT is currently in bankruptcy protection. | ||||||
| Table 2 | ||||||
The stock price data for the Fossil Fuel Portfolio are in Table 3, below.
| Fossil Fuel Portfolio – Stock Prices | ||||||
| Item | Company | Symbol | 12/21/12 | 11/20/15 | Delta | Delta % |
| 1 | BP | BP | 42.1 | 34.4 | -7.68 | -18.23% |
| 2 | Chevron Texaco | CVX | 109.7 | 89.0 | -20.71 | -18.88% |
| 3 | Conoco Philips | COP | 58.6 | 52.9 | -5.67 | -9.68% |
| 4 | Exxon Mobil | XOM | 87.2 | 79.8 | -7.47 | -8.56% |
| 5 | Royal Dutch Shell | RDS.A | 69.3 | 49.7 | -19.61 | -28.30% |
| 6 | Haliburton | HAL | 34.7 | 38.0 | 3.30 | 9.51% |
| 7 | Transocean | RIG | 45.6 | 13.9 | -31.73 | -69.52% |
| 8 | Peabody Coal | BTU | 395.3 | 11.3 | -383.93 | -97.14% |
| Table 3 | ||||||
The valuation data for the Sustainable Energy Portfolio are in Table 4, below.
| Sustainable Energy Portfolio – Valuation | ||||||
| Value | Delta | |||||
| Item | Company | Symbol | 12/21/12 | 11/20/15 | Delta | Delta % |
| 1 | Cree | CREE | 1,000 | 755 | -245 | -24.53% |
| 2 | First Solar | FSLR | 1,000 | 1,466 | 466 | 46.58% |
| 3 | GT Adv. Tech. | GTAT | 1,000 | 74 | -926 | -92.60% |
| 4 | Lighting Science | LSCG | 1,000 | 187 | -813 | -81.33% |
| 5 | Next Era Energy | NEE | 1,000 | 1,443 | 443 | 44.31% |
| 6 | Sun Power | SPWR | 1,000 | 4,273 | 3,273 | 327.26% |
| 7 | Solazyme | SZYM | 1,000 | 360 | -640 | -64.03% |
| 8 | Vestas | VWS | 1,000 | 9,803 | 8,803 | 880.35% |
| total | 8,000 | 18,360 | 10,360 | 129.50% | ||
| Values in thousands. | ||||||
| Table 4 | ||||||
The valuation data for the Fossil Fuel Portfolio are in Table 5, below.
| Fossil Fuel Portfolio – Valuations | ||||||
| Value | Delta | |||||
| Item | Company | Symbol | 12/21/12 | 11/20/15 | Amount | Per Cent |
| 1 | BP | BP | 1,000 | 818 | -182 | -18.23% |
| 2 | Chevron Texaco | CVX | 1,000 | 811 | -189 | -18.88% |
| 3 | Conoco Philips | COP | 1,000 | 903 | -97 | -9.68% |
| 4 | Exxon Mobil | XOM | 1,000 | 914 | -86 | -8.56% |
| 5 | Royal Dutch Shell | RDS.A | 1,000 | 717 | -283 | -28.30% |
| 6 | Haliburton | HAL | 1,000 | 1,095 | 95 | 9.51% |
| 7 | Transocean | RIG | 1,000 | 305 | -695 | -69.52% |
| 8 | Peabody Coal | BTU | 1,000 | 29 | -971 | -97.10% |
| total | 8,000 | 5,592 | -2,408 | -30.10% | ||
| Values in thousands. | ||||||
| Table 5 | ||||||
The market capitalization data for the Sustainable Energy Portfolio are in Table 6.
| Sustainable Energy Portfolio | |||
| Market Capitalization (Billions) | |||
| Item | Company | 12/21/12 | 11/20/15 |
| 1 | Cree | 3.90 | 2.64 |
| 2 | First Solar | 2.69 | 5.49 |
| 3 | GT Adv. Tech. | 0.36 | 0.00 |
| 4 | Lighting Science | 0.15 | 0.00 |
| 5 | Next Era Energy | 29.60 | 46.52 |
| 6 | Sun Power | 0.88 | 3.17 |
| 7 | Solazyme | 0.52 | 0.24 |
| 8 | Vestas | 1.48 | 13.86 |
| total | 39.58 | 71.93 | |
| Table 6 | |||
The market capitalization data for the Fossil Fuel Portfolio are in Table 7.
| Fossil Fuel Portfolio – Market Capitalization | |||
| Market Capitalization (Billions) | |||
| Item | Company | 12/21/12 | 11/20/15 |
| 1 | BP | 133.8 | 106.75 |
| 2 | Chevron Texaco | 214.7 | 167.52 |
| 3 | Conoco Philips | 71.2 | 65.35 |
| 4 | Exxon Mobil | 397.7 | 332.29 |
| 5 | Royal Dutch Shell | 216.8 | 161.03 |
| 6 | Haliburton | 32.2 | 32.51 |
| 7 | Transocean | 16.4 | 5.09 |
| 8 | Peabody Coal | 6.37 | 0.21 |
| total | 1089.2 | 870.75 | |
| Table 7 | |||
Posts in this series
- L. Furman, 12/21/12, Popular Logistics Sustainable Energy Portfolio
- L. Furman, 2/8/13, Nega-Watts, Nega-Fuel-Watts, Mega-Bucks
- L. Furman, 2/9/13, Gold Bricks and Sink-Holes – The Risk & Reward of Fossil Fuel, Solar & Wind
- L. Furman, 3/2/13, Sustainable Energy Portfolio UP 16% & Fossil Fuel Portfolio Up 1.7% – Since Dec.21, 2012
- L. Furman, 3/23/13, Portfolio Simulation At 3 Months: Sustainable Energy: Up 22%. Fossil Fuels: 3%
- L. Furman, 4/26/13, Earth Day, 2013. Oil Spills, Explosions, Fracking Business As Usual & The Stock Market Response
- L. Furman, 5/13/13, Popular Logistics Energy Portfolios: The Trend Continues.
- L. Furman, 6/24/13, Popular Logistics Energy Portfolios: At 6 months
- L. Furman, 7/22/13, Popular Logistics Energy Portfolios: Sustainable Energy Doubles. Fossil Fuels increase 5.4%
- L. Furman, 8/22/13, Popular Logistics Energy Portfolios: An Exercise in Climate Capitalism
- L. Furman, 9/20/13, Energy Portfolios – Investing for the Future
- L. Furman, 10/21/13, Sustainable Investing – Green Energy, Green Economy
- L. Furman, 11/22/13, Energy Portfolios: Minor Corrections, Overall Results In Line With the Trend
- L. Furman, 12/23/13, Energy Portfolios at One Year Sustainable Energy up 140%. Fossil Fuels up 9.85%
- L. Furman, 12/26/13, Energy Portfolios and Reference Indices, 2013 Summary.
- L. Furman, 1/22/14, Energy Portfolios: 13 Months, Sustainable Energy up 167.4%, Fossil Fuels up 9.44%
- L. Furman, 2/24/14, Energy Portfolios: 14 Months: Sustainable Energy up 184.4%, Fossil Fuels up 8.7%
- L. Furman, 3/23/14, Energy Portfolios: 15 Months: Sustainable Energy up 222.6, Fossil Fuel up 7.3%
- L. Furman, 4/22/14, Energy Portfolios, 16 Months: Sustainable Energy up 204.25%, Fossil Fuel up 15.38%
- L. Furman, 5/21/14, Energy Portfolios, 17 Months: Sustainable Energy up 211.6%, Fossil Fuels up 18.5%
- L. Furman, 6/24/14, Energy Portfolios, 18 Months: Sustainable Energy up 257%, Fossil Fuels up 24.6%
- L. Furman, 6/26/14, Energy Portfolios: 18 Months, Analysis
- L. Furman, 7/22/14, Energy Portfolios: 19 Months: Sustainable Energy up 222%, Fossil Fuels up 25%
- L. Furman, 8/23/14, Energy Portfolios: 20 Months: Sustainable Energy up 229%, Fossil Fuels up 18.4%
- L. Furman, 8/29 /14, Energy Portfolios: 20 Months: Conclusion & Observations
- L. Furman, 10/1/14, The Paradigm Is Shifting; Fossil Fuels Are Becoming Fossils
- L. Furman, 10/7/14, Cree: Strong Financials, But …
- L. Furman, 10/21/14, Energy Portfolios: 22 Months: Sustainable Energy Up But Dropping.
- L. Furman, 11/27/14, Energy Portfolios: 23 Months: Sustainable Energy DOUBLED, Fossil Fuel Down (slightly).
- L. Furman, 12/28/14, Energy Portfolios: 24 Months: Sustainable Energy Up 91%, Fossil Fuel DOWN 10%.
- L. Furman, 1/27/15, Energy Portfolios: 2 Years, 1 Month, Sustainable Up 85%, Fossil Fuels DOWN 15%
- L. Furman, 2/23/15, Energy Portfolios: 2 Years, 2 Months, Sustainable Up 109%, Fossil Fuels DOWN 12%.
- L. Furman, 3/21,15, Energy Portfolios, 2 Years 3 Months: Sustainable up 128%, Fossil Fuel DOWN 16%.
- L. Furman, 4/21/15, Energy Portfolios, 2 Years 4 Months: Sustainable up 138%, Fossil Fuel DOWN 12%.
- L. Furman, 5/21/15, Energy Portfolios, 2 Years 5 Months: Sustainable up 137%, Fossil Fuel DOWN 13.7%.
- L. Furman, 6/21/15, Energy Portfolios, 2 Years 6 Months: Sustainable up 128%, Fossil Fuel DOWN 18%.
- L. Furman, 7/23/15, Energy Portfolios, 2 Years 7 Months: Sustainable up 121%, Fossil Fuel DOWN 24%.
- L. Furman, 8/22/15, Energy Portfolios, 2 Years 8 Months: Sustainable up 102%, Fossil Fuel DOWN 34.3%.
- L. Furman, 8/26/15, Energy Portfolios and “The Correction“.
- L. Furman, 10/1/15, Energy Portfolios, 2 Years 9 Months: Sustainable up 111.3%, Fossil Fuels DOWN 33.5%.
- L. Furman, 10/22/15, Energy Portfolios, 2 Years 10 Months: Sustainable Energy Up 125%, Fossil Fuel DOWN 27%.
- L. Furman, 11/23/15, Energy Portfolios, 2 Years 11 Months: Sustainable Energy Up 129%, Fossil Fuel DOWN 29.6%.
–
An analyst with Popular Logistics, I hold a BS and an MBA in “Managing for Sustainability” from Marlboro College, and over 20 years experience in Information Technology. Available as a speaker and consultant, I can be reached at “L Furman” at Popular Logistics . com”. Investments in equities are risky. I do NOT hold a Series 7 license from the SEC or any other corresponding credential from any other agency. I am NOT a licensed stock broker, investment adviser or financial adviser and this should n0t be considered “Financial Advice” or “Investment Advice.” I am simply an observant fellow with access to the Internet.