Writing for “Virginia Mercury,” Ivy Main says,
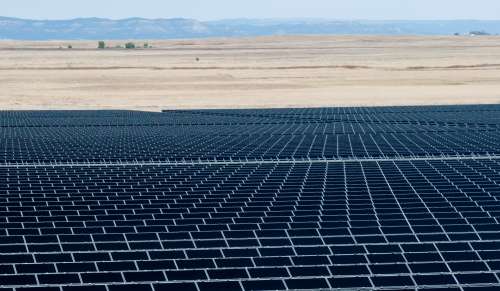
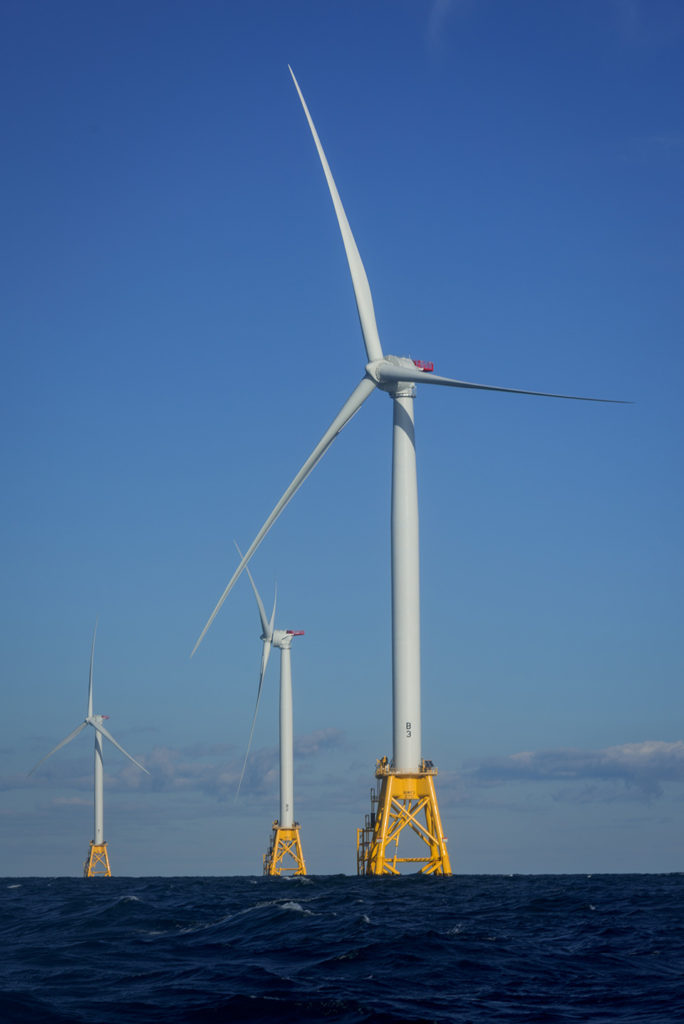
What is certain is that improvements in wind, solar, battery storage and electric vehicles will continue these technologies’ march to dominance, while fossil fuels become niche. Concerns about the land needs of renewable energy are overblown; you could power the entire U.S. with solar panels on just one-third of the more than 30 million acres currently devoted to growing corn for climate-unfriendly ethanol. Indeed, solar doesn’t even have to displace farming. Agrivoltaics is already making solar and agriculture compatible and creating money-saving synergies.
I am sure she is correct. Consider the the logistics and life cycles of the PV Solar and Corn to Ethanol systems and the Second Law of Thermodynamics. The 2nd law basically “The entropy of the universe increases.” (Entropy is randomness or disorder. And this is high school physics.)
Imagine a building w a solar roof. The sun shines on the roof, and it powers the building (except at night or when it’s raining or snowing). One stop shopping.
Imagine a corn to ethanol operation.
- Plant corn.
- Apply fertilizer.
- Apply pesticides.
- Repeat 2 and 3 as needed.
- Harvest the corn.
- Process it into ethanol.
- Ship the ethanol to a facility where it is mixed into gasoline.
- Ship the gas-methanol mixture to gas stations.
- Repeat.
Not quite as simple.
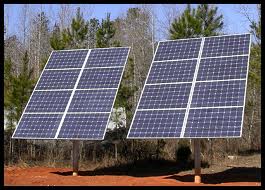
Solar modules generate electricity by converting photons into electric current.
Ethanol farms convert photons into corn, which must be harvested, then processed. Growing the crop probably uses fertilizer and pesticides, because the corn to ethanol operations are probably not organic farms. The tractors required for planting, harvesting, etc require fuel, maintenance. The factories in which the corn is transformed into ethanol require power and maintenance, and if they have moving parts, lubricants. Transporting the ethanol requires tankers, pipelines, etc.
Solar is one step. Corn to ethanol is multiple steps. Entropy is created, energy is lost in each step. (Energy is also lost in solar when 1) the direct current generated by a PV solar module is inverted into DC and 2) the electricity travels thru transmission lines.)
And PV Solar works with low maintenance for 20 to 30 years. While corn to ethanol planting, harvesting, processing need to be repeated every year.
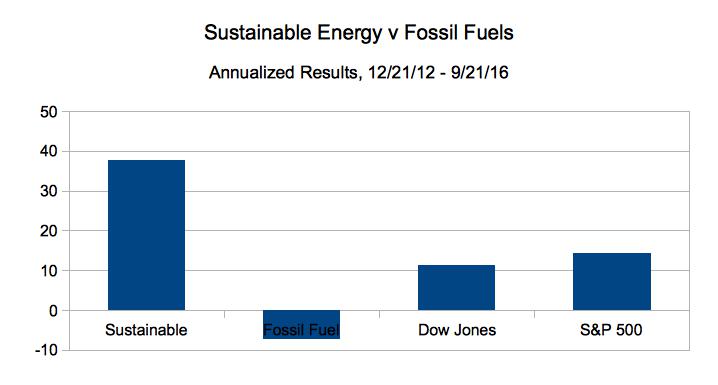
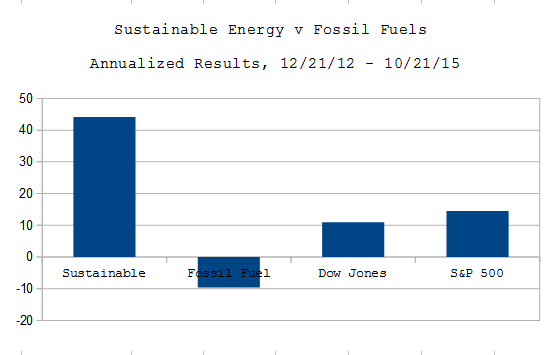
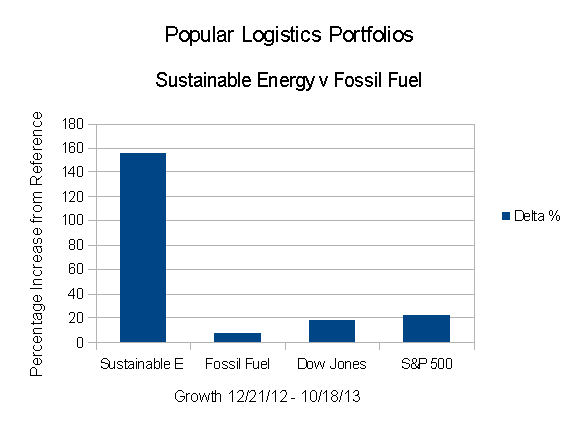
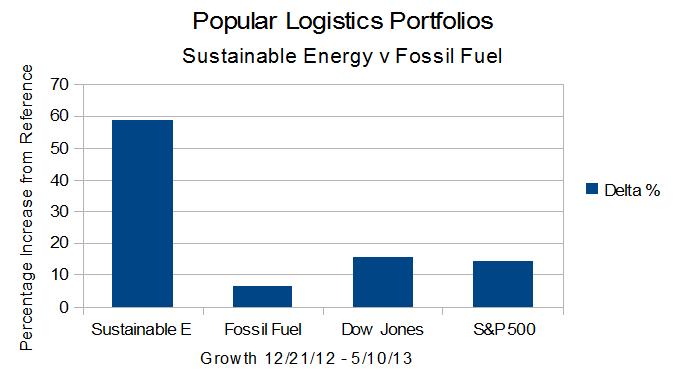
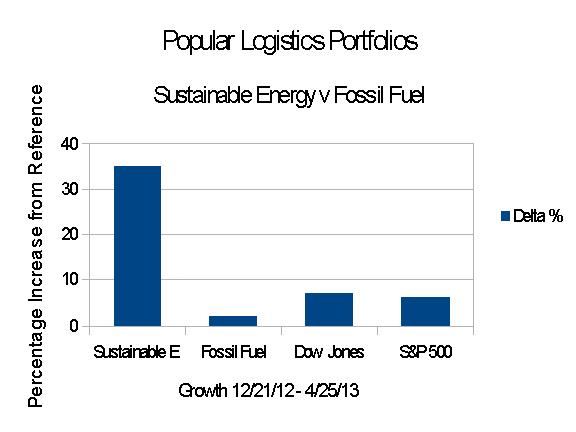
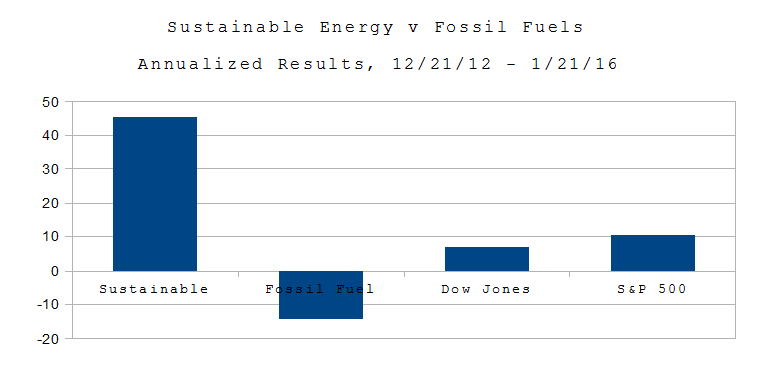 Wall St. 1/21/16. On Dec. 21, 2012, I put $16 Million imaginary dollars in equal imaginary investments in 16 real energy companies; $8.0 in the Sustainable Energy space and $8.0 in the fossil fuel space.
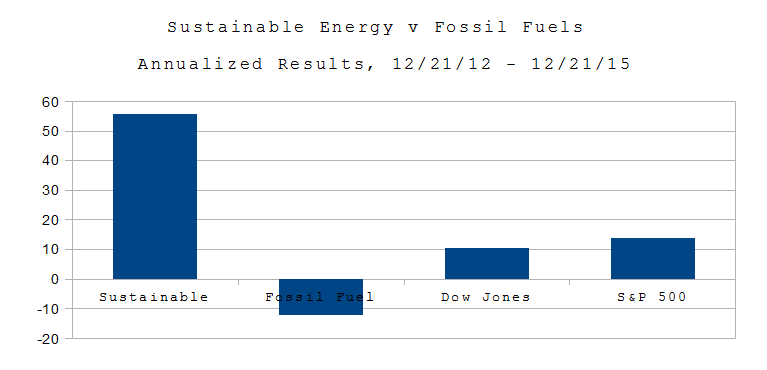 On Dec. 21, 2012, I put $16 Million imaginary dollars in equal imaginary investments in 16 real energy companies; $8.0 in the Sustainable Energy space and $8.0 in the fossil fuel space. Excluding the value of dividends and transaction costs, but including the bankruptcy or crash of three companies in the sustainable energy space.